


28. 10. 2022
Log Management, Log-SIEM, NetEye

Suppose you have an OpenLDAP Server and you want to analyze what it does. A good way to do this is to send the logs to NetEye’s LogServer. Some elements you will see include:
– Returned Entries! (ENTRY)
– Search Operations! (SEARCH)
– Total Connections! (BIND)
To do this you need to add a new logstash filter this way:
# BEGIN OPENLDAP LOG
filter {
  if [program] == "slapd" {
    grok {
        match => [ "message", "(?:(?:<= (?:b|m)db_%{DATA:index_error_filter_type}_candidates: \(%{WORD:index_error_attribute_name}\) not indexed)|(?:ppolicy_%{DATA:ppolicy_op}: %{DATA:ppolicy_data})|(?:connection_input: conn=%{INT:connection} deferring operation: %{DATA:deferring_op})|(?:connection_read\(%{INT:fd_number}\): no connection!)|(?:conn=%{INT:connection} (?:(?:fd=%{INT:fd_number} (?:(?:closed(?: \(connection lost\)|))|(?:ACCEPT from IP=%{IP:src_ip}\:%{INT:src_port} \(IP=%{IP:dst_ip}\:%{INT:dst_port}\))|(?:TLS established tls_ssf=%{INT:tls_ssf} ssf=%{INT:ssf})))|(?:op=%{INT:operation_number} (?:(?:(?:(?:SEARCH )|(?:))RESULT (?:tag=%{INT:tag}|oid=(?:%{DATA:oid}(?:))) err=%{INT:error_code}(?:(?: nentries=%{INT:nentries})|(?:)) text=(?:(?:%{DATA:error_text})|(?:)))|(?:%{WORD:operation_name}(?:(?: %{DATA:data})|(?:))))))))%{SPACE}$" ] remove_tag => "_grokparsefailure"
        add_tag => "openldap"
    }
    if [operation_name] == "BIND" {
      grok {
        match => [ "data", "(?:(?:(?anonymous))|(?:dn=\"%{DATA:bind_dn}\")) (?:(?:method=%{WORD:bind_method})|(?:mech=%{WORD:bind_mech} ssf=%{INT:bind_ssf}))%{SPACE}$" ]
        remove_field => [ "data" ]
      }
    }
    if [operation_name] == "SRCH" {
      grok {
        match => [ "data", "(?:(?:base=\"%{DATA:search_base}\" scope=%{INT:search_scope} deref=%{INT:search_deref} filter=\"%{DATA:search_filter}\")|(?:attr=%{DATA:search_attr}))%{SPACE}$" ]
        remove_field => [ "data" ]
      }
    }
    if [operation_name] == "MOD" {
      grok {
        match => [ "data", "(?:(?:dn=\"%{DATA:mod_dn}\")|(?:attr=%{DATA:mod_attr}))%{SPACE}$" ]
        remove_field => [ "data" ]
      }
    }
    if [operation_name] == "MODRDN" {
      grok {
        match => [ "data", "dn=\"%{DATA:modrdn_dn}\"%{SPACE}$" ]
        remove_field => [ "data" ]
      }
    }
    if [operation_name] == "ADD" {
      grok {
        match => [ "data", "dn=\"%{DATA:add_dn}\"%{SPACE}$" ]
        remove_field => [ "data" ]
      }
    }
    if [operation_name] == "DEL" {
      grok {
        match => [ "data", "dn=\"%{DATA:del_dn}\"%{SPACE}$" ]
        remove_field => [ "data" ]
      }
    }
    if [operation_name] == "CMP" {
      grok {
        match => [ "data", "dn=\"%{DATA:cmp_dn}\" attr=\"%{DATA:cmp_attr}\"%{SPACE}$" ]
        remove_field => [ "data" ]
      }
    }
    if [operation_name] == "EXT" {
      grok {
        match => [ "data", "oid=%{DATA:ext_oid}%{SPACE}$" ]
        remove_field => [ "data" ]
      }
    }
    if [ppolicy_op] == "bind" {
      grok {
        match => [ "ppolicy_data", "(?:(?:Entry %{DATA:ppolicy_bind_dn} has an expired password: %{INT:ppolicy_grace} grace logins)|(?:Setting warning for password expiry for %{DATA:ppolicy_bind_dn} = %{INT:ppolicy_expiration} seconds))%{SPACE}$" ]
        remove_field => [ "ppolicy_data" ]
      }
    }
  }
}
# END OPENLDAP LOG
Using this filter you can then have a Dashboard in Kibana that looks like this:
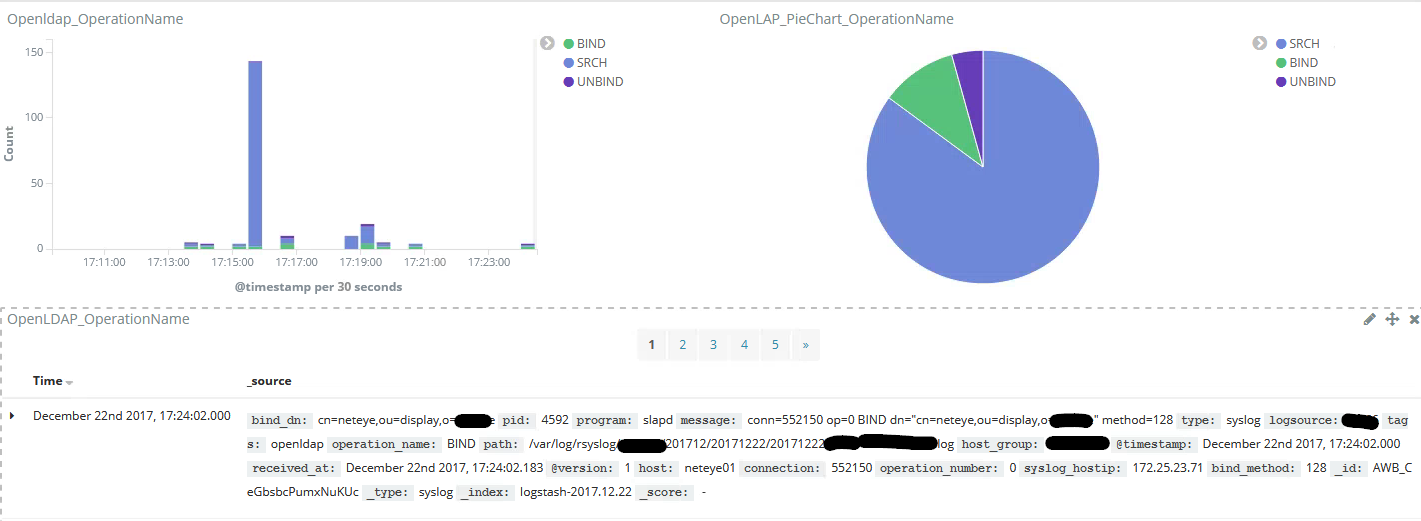
I hope you enjoy this new log feature in your LogServer.

Juergen Vigna
NetEye Solution Architect at Würth IT Italy
I have over 20 years of experience in the IT branch. After first experiences in the field of software development for public transport companies, I finally decided to join the young and growing team of Würth Phoenix (now Würth IT Italy). Initially, I was responsible for the internal Linux/Unix infrastructure and the management of CVS software. Afterwards, my main challenge was to establish the meanwhile well-known IT System Management Solution WÜRTHPHOENIX NetEye. As a Product Manager I started building NetEye from scratch, analyzing existing open source models, extending and finally joining them into one single powerful solution. After that, my job turned into a passion: Constant developments, customer installations and support became a matter of personal. Today I use my knowledge as a NetEye Senior Consultant as well as NetEye Solution Architect at Würth Phoenix.
Author
Latest posts by Juergen Vigna
22. 05. 2025
NetEye, Unified Monitoring
Automatic Integration of NagVis Map into Icinga Web 2/NetEye Monitoring