15. 06. 2026
NetEye, Unified Monitoring

Grok is a plug-in installed by default in Logstash, which is supplied with the Elastic package (the ELK – Elasticsearch, Logstash and Kibana), one of the integrated modules in our NetEye Unified Monitoring solution.
What is this plug-in for?
First of all, Grok is an English neologism that means “to understand profoundly, intuitively or by empathy, to establish a rapport with”. Grok (the plug-in) is the best way to parse an unstructured log by translating it into structured data.
In fact, it’s thanks to Grok that we are able to interpret the logs received from Logstash, where it extrapolates the fields that will be indexed in Elasticsearch and displayed in Kibana.
By making matches, Grok detects the correspondences in each line in a log and stores the data we need by inserting it into a database field.
When does Grok help us?
Suppose we add a new firewall in the NetEye Log Management that will send its logs to rsyslog. These logs, according to the applied configurations, will be saved in the directory /var/log/rsyslog/ and read by Logstash. However, Logstash on its own is not able to interpret a log. Grok, instead, will read the content line by line to extrapolate the fields that we have defined.
How are a Logstash file and the syntax of Grok constructed?
I admit that the syntax of a Logstash file is not that simple, but with a little work, we can soon understand it.
filter {
if [type] == “syslog” and [message] =~ /.*Safed\[\d+\]\[\d+\].*/ {
grok {
match => [ “message”, “%{SYSLOGTIMESTAMP:timestamp} %{SYSLOGHOST:logsource} Safed\[%{POSINT}\]\[%{POSINT}\]:%{SPACE}+ %{GREEDYDATA:message}” ]
add_field => [ “received_at”, “%{@timestamp}” ]
add_tag => “SAFED”
overwrite => [ “message” ]
break_on_match => false
}
In this excerpt from the NetEye Logstash files, we see how the configuration file is structured:
- filter – identifies a Logstash component that is able to process the logs it receives
- grok – identifies the plug-in used within Logstash to interpret the log and extract the data
Let’s analyze the Grok filter in particular:
“%{SYSLOGTIMESTAMP:timestamp} %{SYSLOGHOST:logsource} Safed\[%{POSINT}\]\[%{POSINT}\]:%{SPACE}+ %{GREEDYDATA:message}”
Let’s compare this pattern to the one in the message field:
- SYSLOGTIMESTAMP – a date time format inserted in the timestamp header
- SYSLOGHOST – a path inserted in the logsource field
- Must meet the Safed regex
- SPACE – a space in the text
- GREEDYDATA – an alphanumeric string inserted in the message field
As you may have noticed, Grok uses some default pattern matches (which are nothing but pre-configured regexes) which we will summarize below:
- MAC – mac address
- IP – IP address
- PATH – Windows or Unix path
- QS – a string in double quotes
- WORD – a string
- INT – an integer string
- And others
We can define pattern matches for Grok and more specifically, we can define the regex of the previous example in a Grok pattern:
SAFED .*Safed\[%{POSINT}\]\[%{POSINT}\]:
Thus replacing SAFED within Grok:
“%{SYSLOGTIMESTAMP:timestamp} %{SYSLOGHOST:logsource}%{SAFED}%{SPACE}+ %{GREEDYDATA:message}”
The new pattern will be inserted into a test file and included in the Logstash configuration file with the following directive:
patterns_dir => [“/opt/logstash/patterns”, “/opt/logstash/extra_patterns”]
You can find documentation on how to create the Grok filter in an online debugger such as:
https://grokdebug.herokuapp.com/
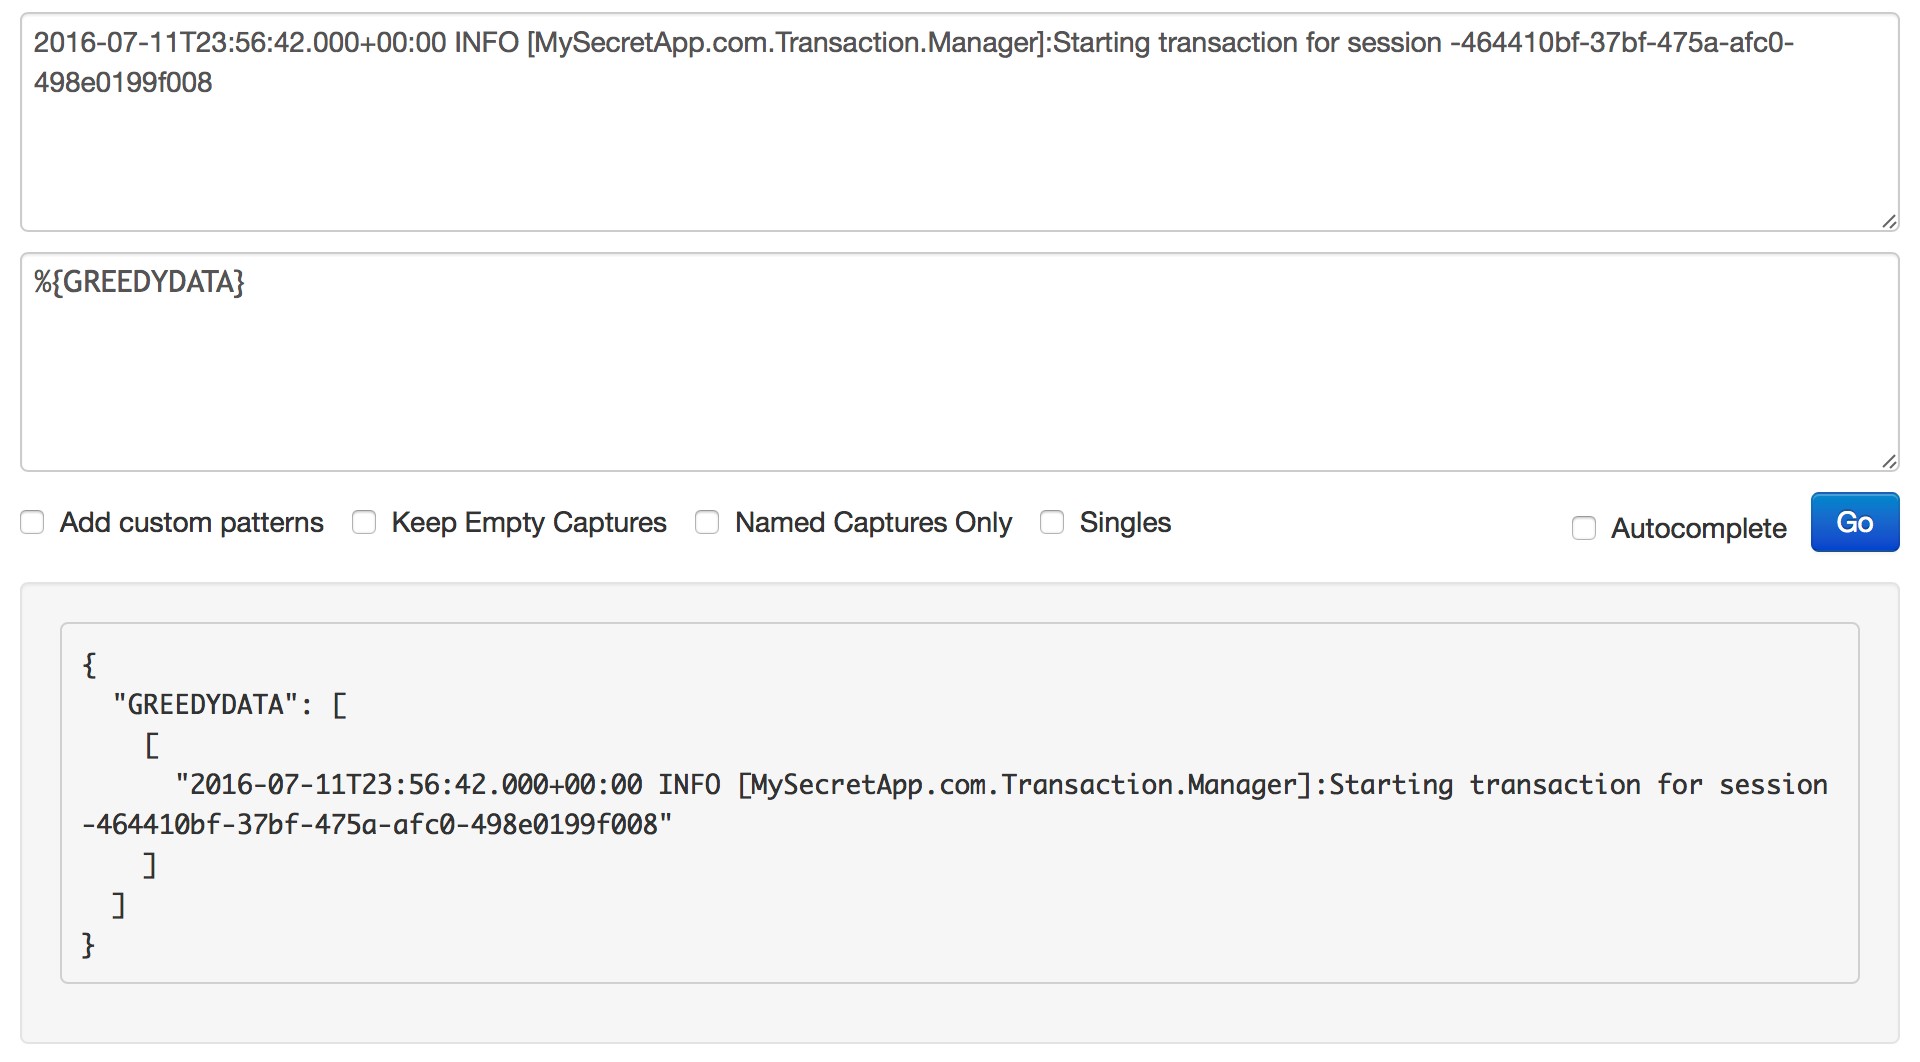
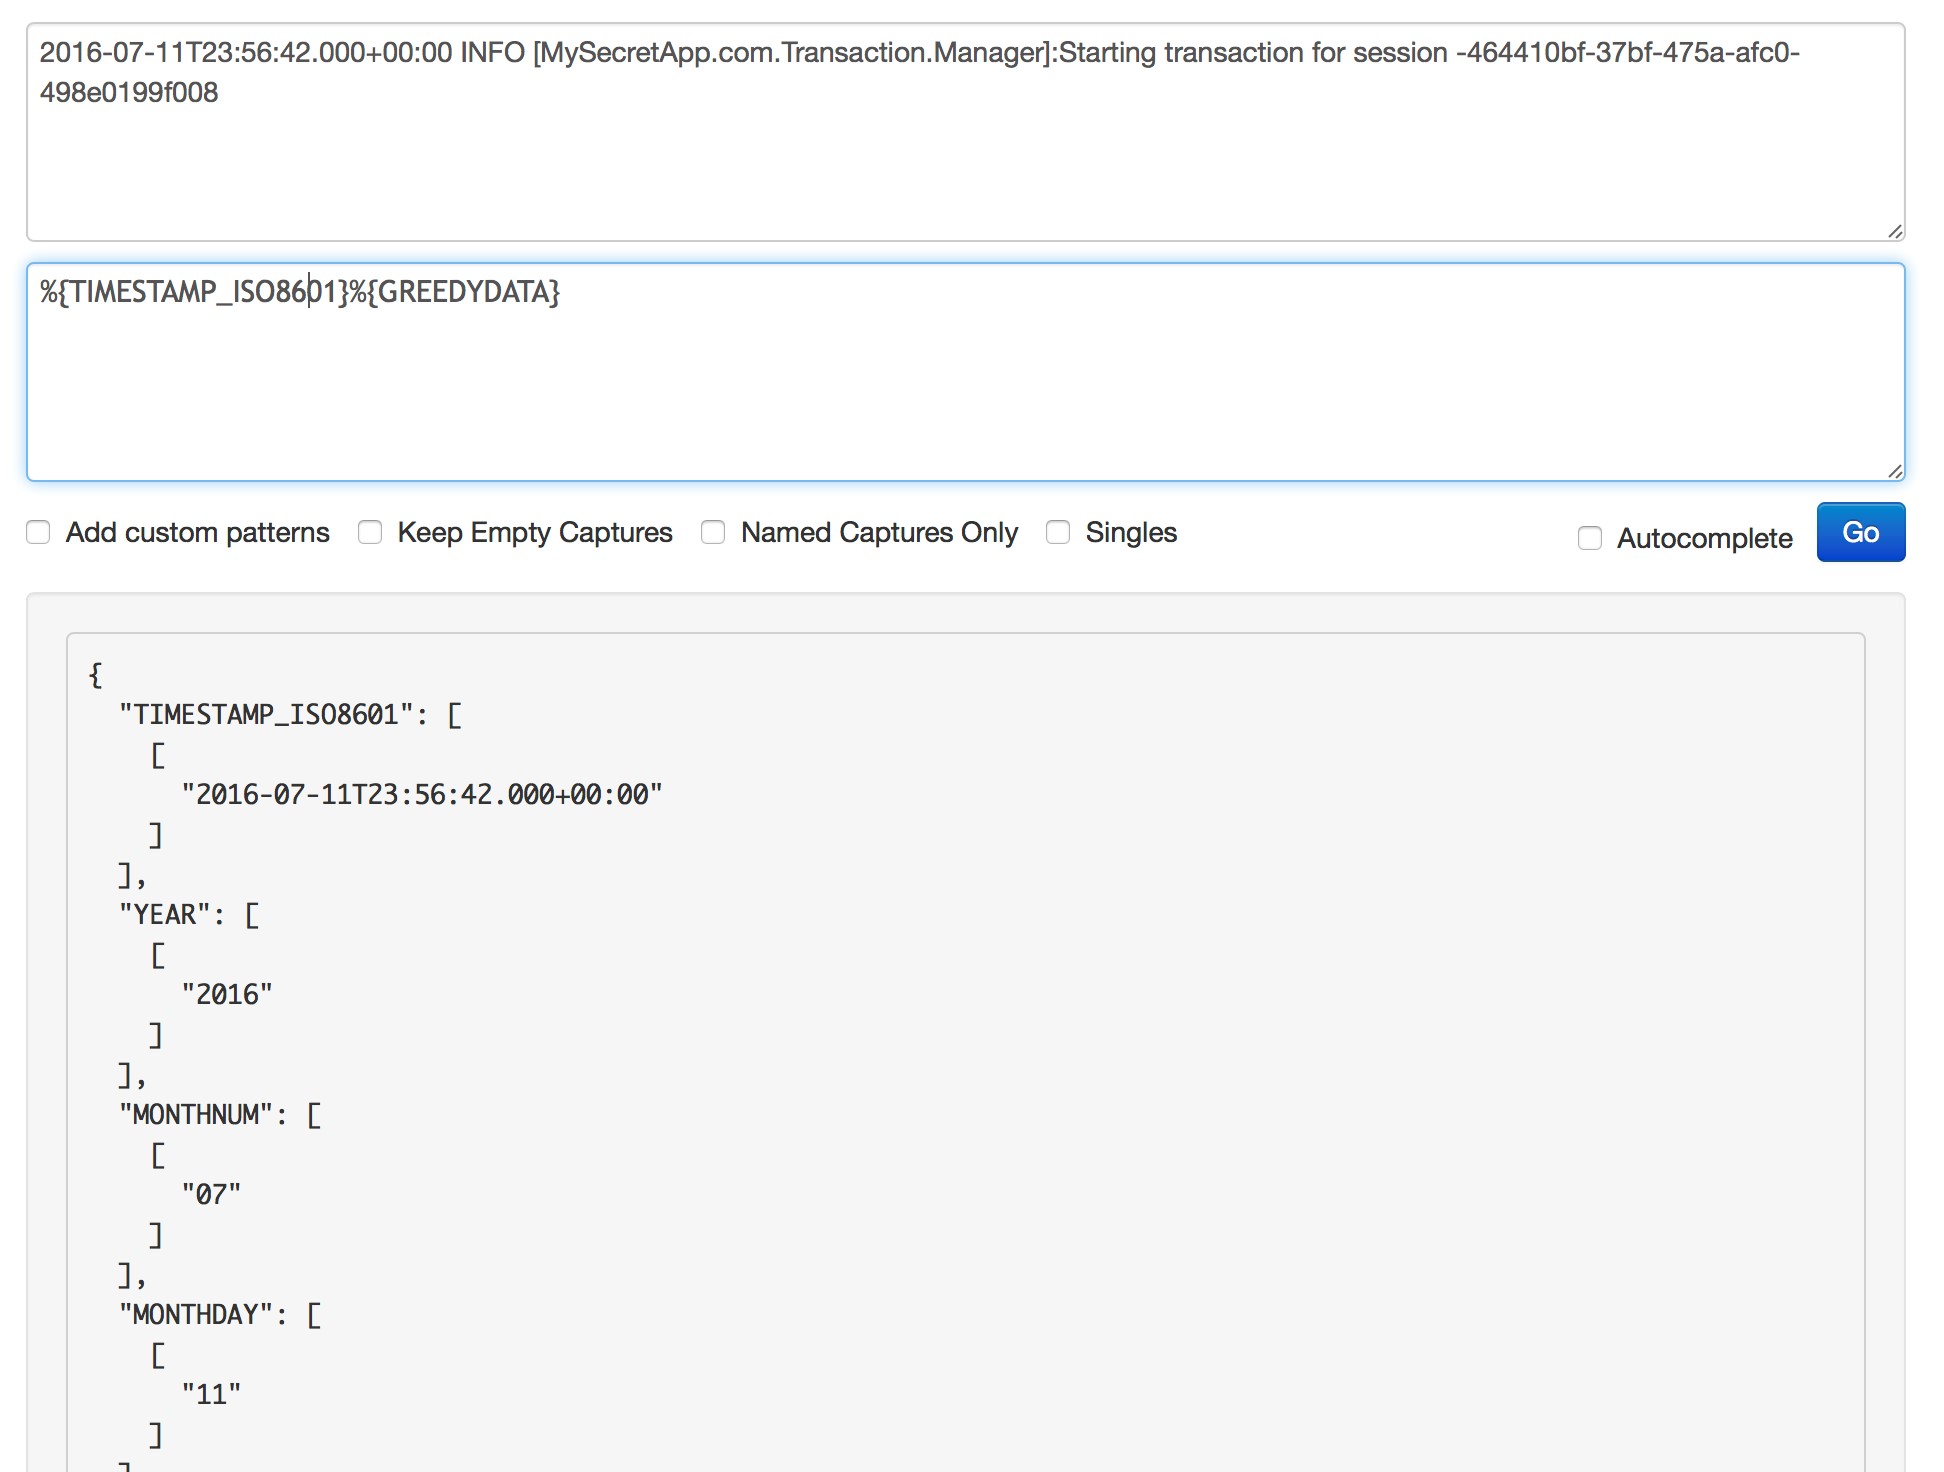
This will allow us to build our Grok rules by checking in real time the match with the log line.
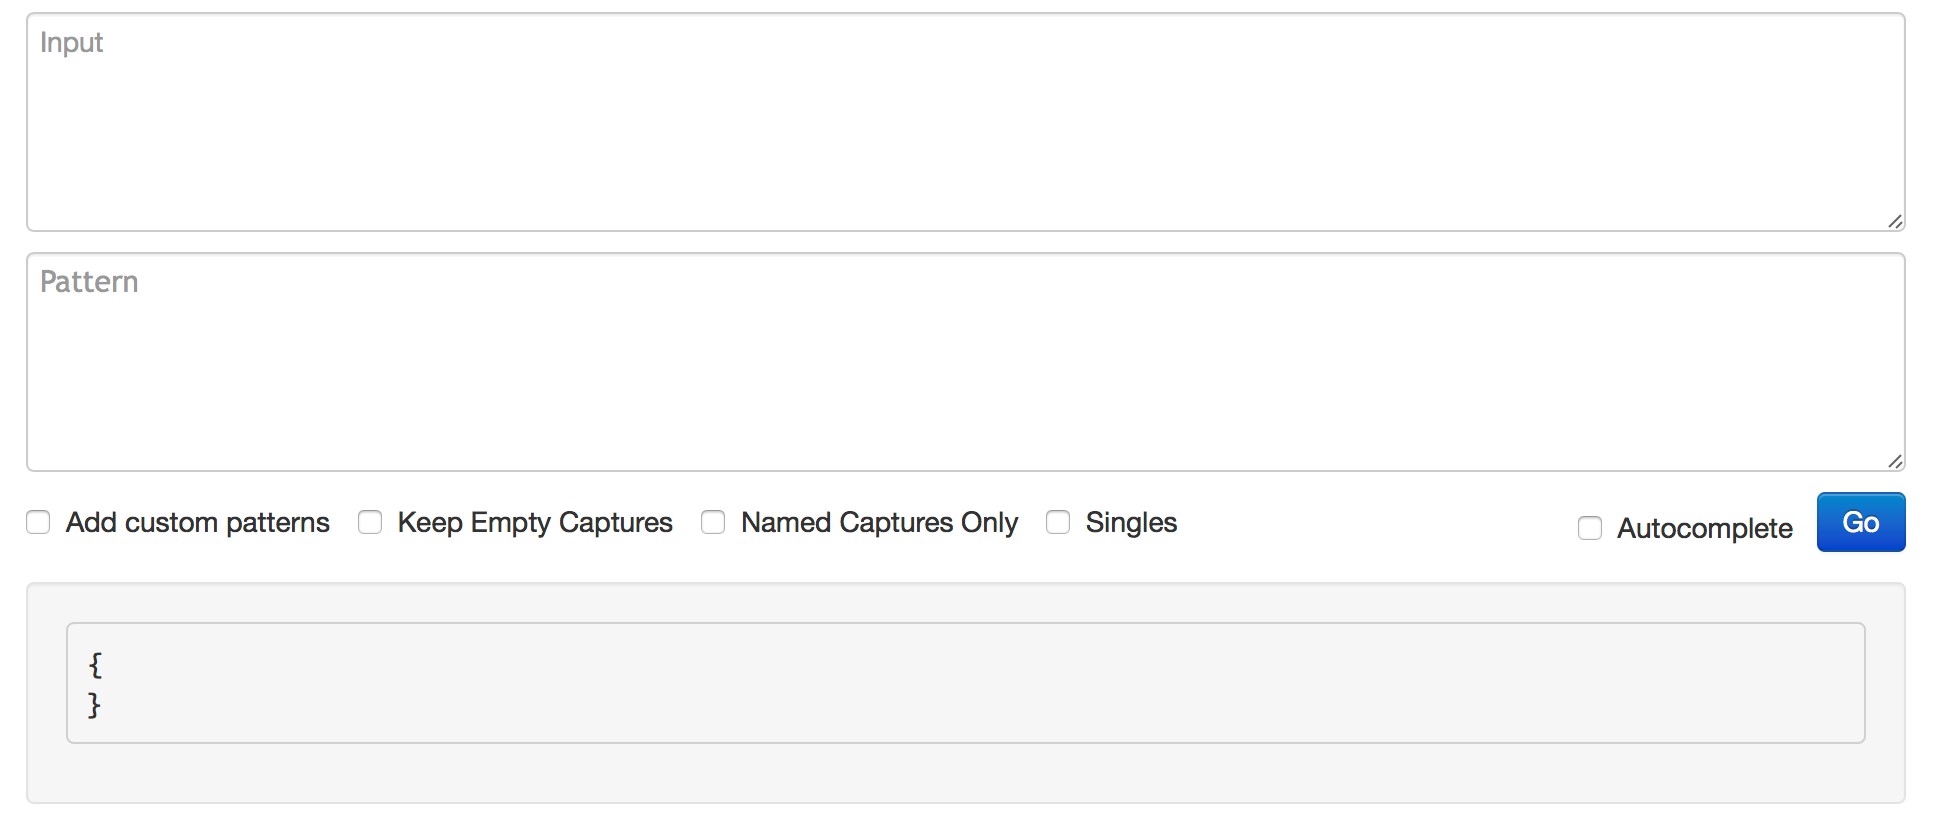
One word of advice is to always start with GREEDYDATA (which matches everything) and gradually remove the other parts of the log starting from the beginning.
With a little practice, you’ll realize that it’s simpler than it seems.
quello che sembra.

Massimiliano De Luca
Consultant at Würth Phoenix
Hi, my name is Massimiliano and I'm the youngest SI Consultant in Würth Phoneix (or my colleagues are very old).
I like: my son Edoardo (when he doesn’t cry), my pet-son Charlie, photography, mountains, linux os, open-source technology and everything I don't know.
I don't like: giving up, the blue screen of Windows, the buffering while I’m watching a movie, latecomers and fake news on internet.
I worked for the VEGA project of the European Space Agency and now I'm very happy about being landed in this company.
I'm ready to share all of my knowledge and my passion whit our customers.
Author
Latest posts by Massimiliano De Luca
21. 12. 2017
NetEye
The Importance of Naming Convention in NetEye
30. 05. 2017
NetEye
IoT: il futuro, oggi.
30. 05. 2017
NetEye
IoT: Die Zukunft ist jetzt