


10. 03. 2026
Unified Monitoring

23. 02. 2024
Juergen Vigna
Log-SIEM, NetEye, Unified Monitoring
Monitoring Logs in Elasticsearch: A Practical Example
Say you want to monitor logs coming into your Elasticsearch instance, and have it send data to your Monitoring Dashboard. I’ll show you how to do this with a practical example, in particular for an event coming from the Active Directory where a user is locked out, and the associated Domain Controller sends the event with the ID 4740: “User Locked Out Account”.
The basis for this example is a NetEye 4.x installation with the SIEM Module installed, containing an Elasticsearch 8.x server, Tornado as the event handler of NetEye 4 with the Core module, and Icinga 2 as the Monitoring Core.
I’ll assume you’ve installed Elastic Agent or a Filebeat Agent on your Domain Controller that sends security events to your Elasticsearch instance. This serves as the basis so that our locked out event arrives on Elasticsearch in some logs-system-* index where you can locate it. The idea is to create an Elasticsearch Alert with a tornado-webhook action that activates a Tornado rule and sets some service in the Icinga 2 monitoring module to CRITICAL.
1. Create a Tornado Webhook to Receive Elasticsearch Events
Create the file 001_elasticsearch-alerts.json inside the directory /neteye/shared/tornado_webhook_collector/conf/webhooks, and afterwards restart the tornado_webhook_collector service. Adapt the this-is-your-alert-token to your needs.
{
  "id": "elasticsearch-alerts",
  "token": "this-is-your-alert-token",
  "collector_config": {
    "event_type": "webhook-elasticsearch-alerts",
    "payload": {
      "data": "${@}"
    }
  }
}
2. Create a Kibana Webhook Connector
Go to StackManagement > Connectors, then “Create connector”, and select the “Webhook” type.
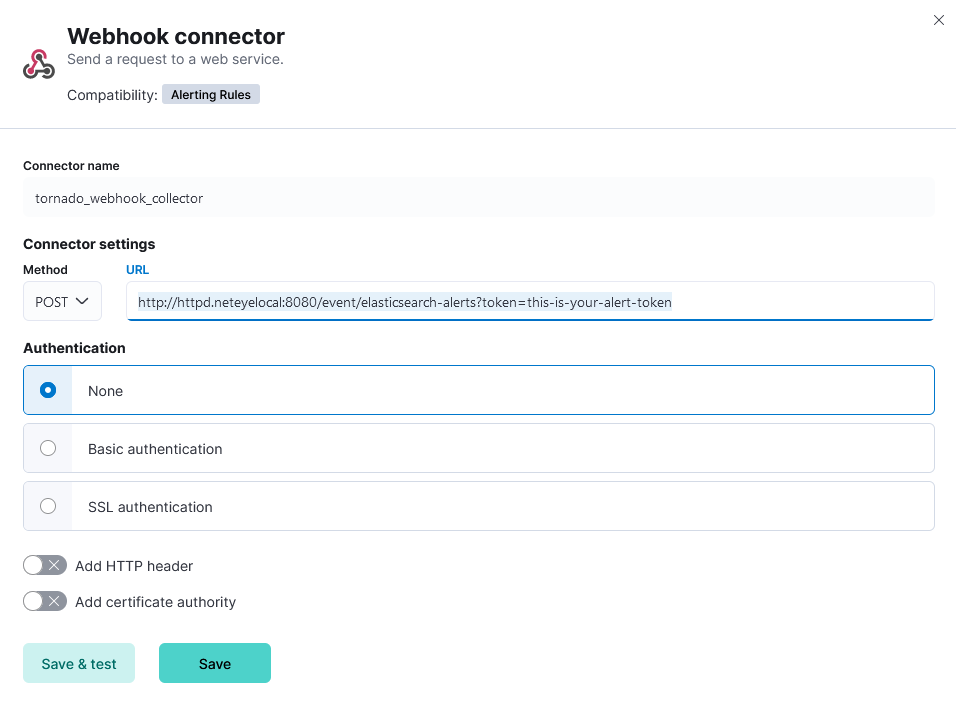
Create a Connector with the name “tornado_webhook_collector” and the POST URL:
http://httpd.neteyelocal:8080/event/elasticsearch-alerts?token=this-is-your-alert-token
The “token” is the one you inserted in your webhook definition in Step #1 above.
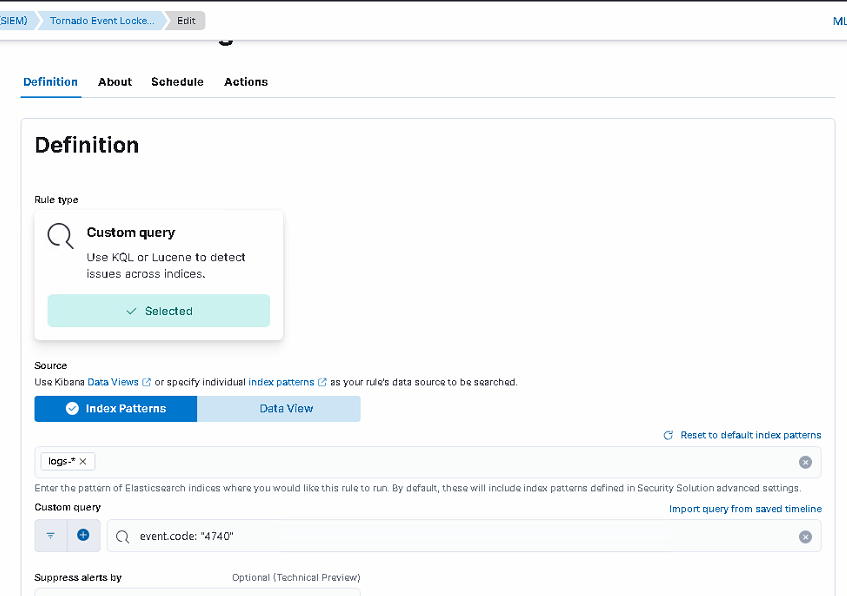
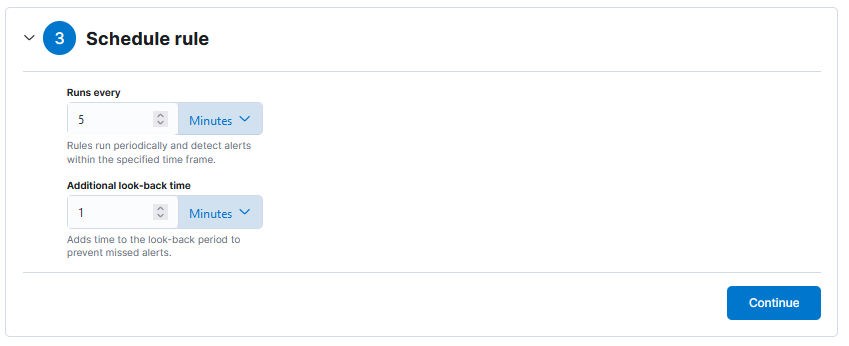
3. Create an Elasticsearch Security Alert Rule
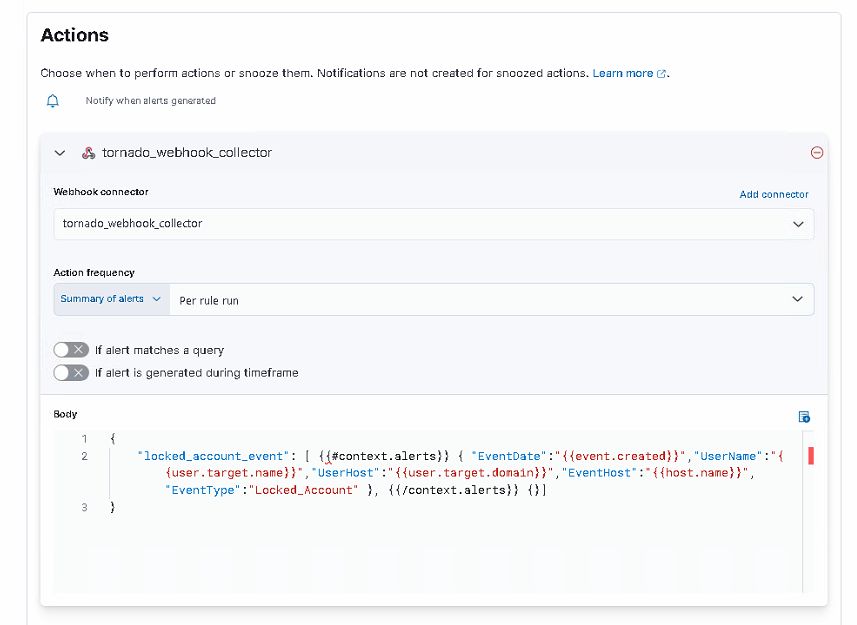
Go to Security > Alerts > Manage Rules > Create New Rule. For this example I’ll use a “Custom Query” and fill the Form in this way. At Step #4 select first “Webhook” Action:
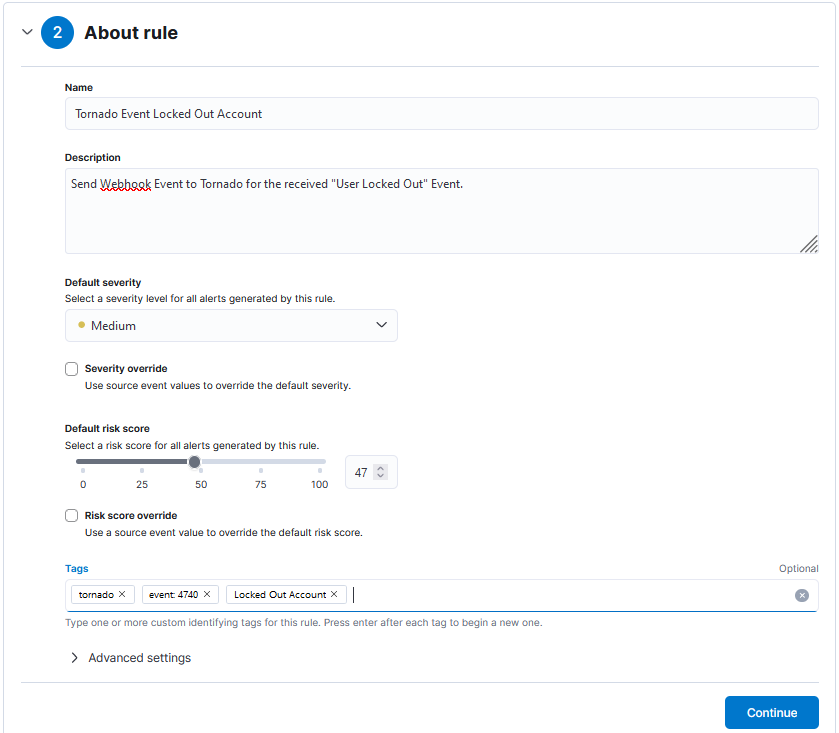
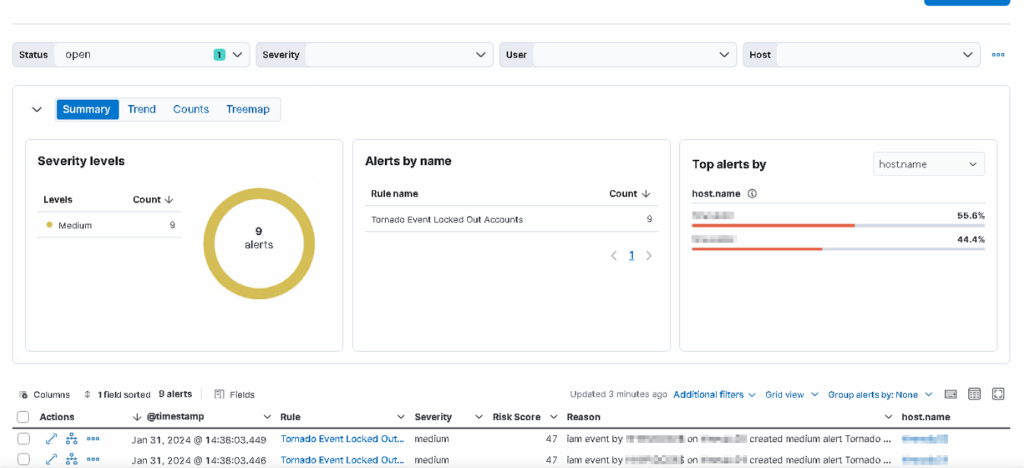
Create and enable your Alert rule. If an Alert arrives you’ll see something like this on the Security > Alerts Page:
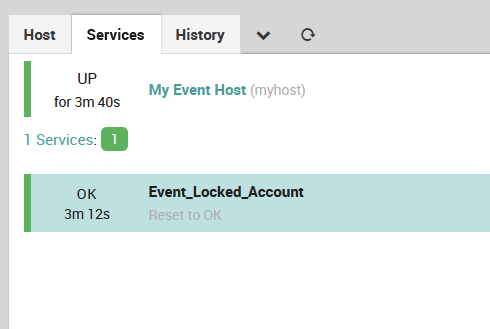
4. Create a Passive Placeholder Service in Monitoring
Create a typical Passive Service on “myhost” with the name Event_Locked_Account. The part after Event should be the same as the EventType string in the Alert JSON in Step #1 above. Be sure to set “Volatile” to yes so that you’ll see all occurrences of the alerts sent within the History of the service, otherwise you’ll only see the first one when the service is set to CRITICAL, and the others won’t be recorded.
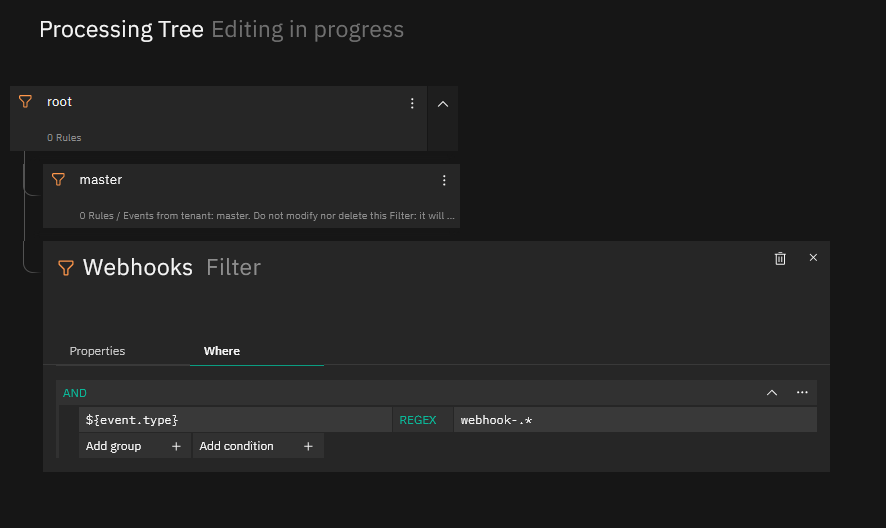
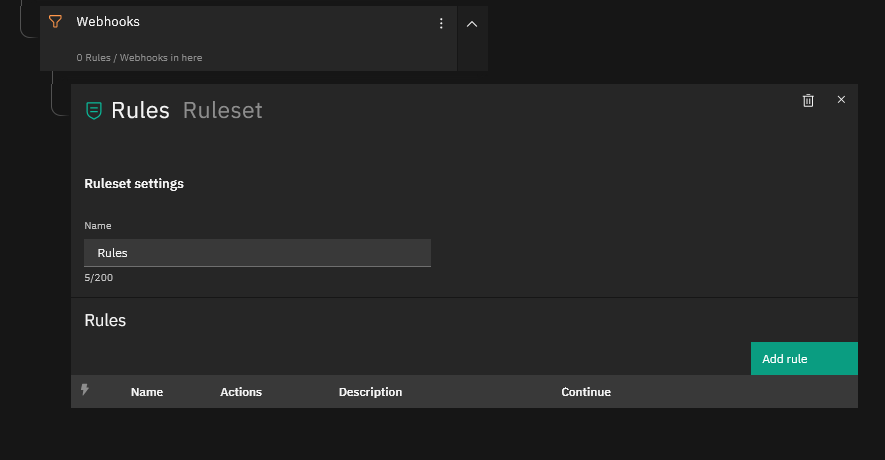
5. Create a Tornado Webhook Rule
Now go to your Tornado WUI and if you haven’t already, create a new Filter Node for Webhooks and below that a new Ruleset Node where you can create your filter rules, then click on “Add rule”. Follow the sequence of screenshots below to create the Rule, on the Action part creating first a “foreach” Action and then inside the “foreach” action, an “icinga2” action since within a single Alert Notification there might be more than one Alert.
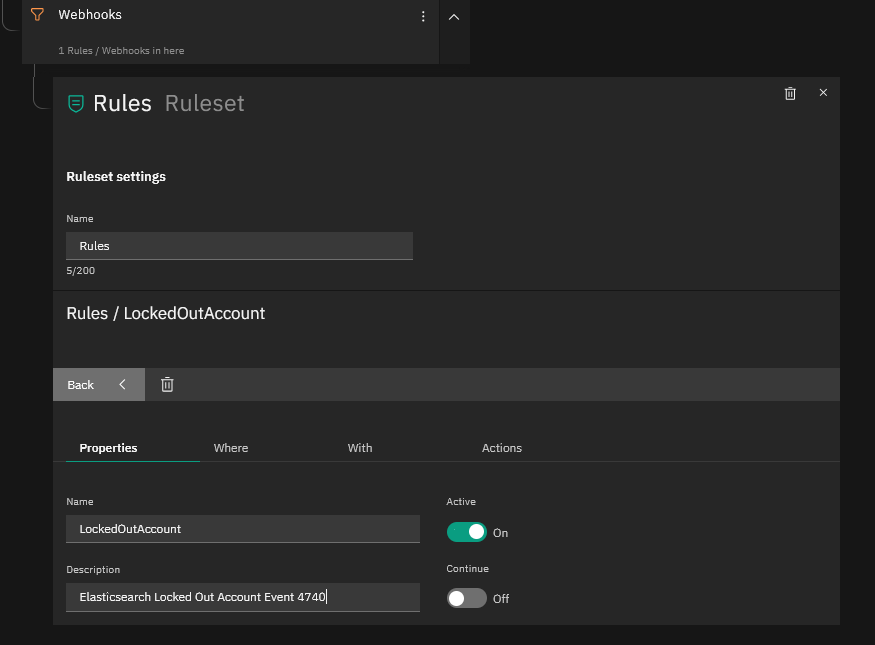
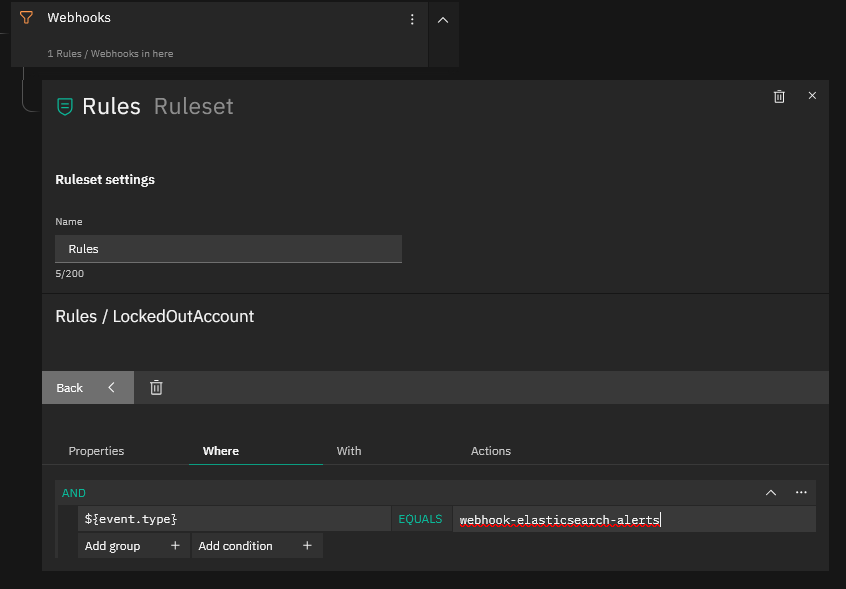
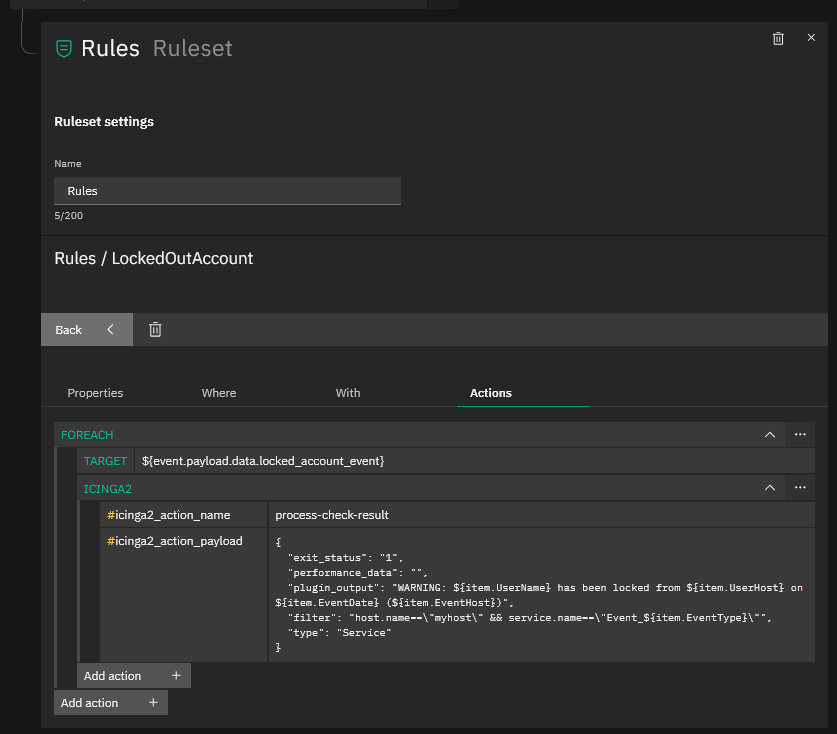
This Tornado Rule should now set the service’s “Event_Locked_Account” to WARNING when an alert arrives. If instead you see the alert as CRITICAL, just change the exit_status to “2” in the Rule definition (see the final screenshot above).
These Solutions are Engineered by Humans
Are you passionate about performance metrics or other modern IT challenges? Do you have the experience to drive solutions like the one above? Our customers often present us with problems that need customized solutions. In fact, we’re currently hiring for roles just like this as well as other roles here at Würth Phoenix.

Juergen Vigna
NetEye Solution Architect at Würth IT Italy
I have over 20 years of experience in the IT branch. After first experiences in the field of software development for public transport companies, I finally decided to join the young and growing team of Würth Phoenix (now Würth IT Italy). Initially, I was responsible for the internal Linux/Unix infrastructure and the management of CVS software. Afterwards, my main challenge was to establish the meanwhile well-known IT System Management Solution WÜRTHPHOENIX NetEye. As a Product Manager I started building NetEye from scratch, analyzing existing open source models, extending and finally joining them into one single powerful solution. After that, my job turned into a passion: Constant developments, customer installations and support became a matter of personal. Today I use my knowledge as a NetEye Senior Consultant as well as NetEye Solution Architect at Würth Phoenix.
Author
Latest posts by Juergen Vigna
22. 05. 2025
NetEye, Unified Monitoring
Automatic Integration of NagVis Map into Icinga Web 2/NetEye Monitoring