Monitoring the SAP HANA DB consists of executing the check_hana.sh script that uses SAP’s hdbclient SQL client to connect to the HANA DB. Included in the script are queries to HANA to find out its status.
Requirements
- USER SAP HANA
- HANA SQL client (hdbsql)
- Script check_hana.sh
But let’s look at the Configuration steps first.
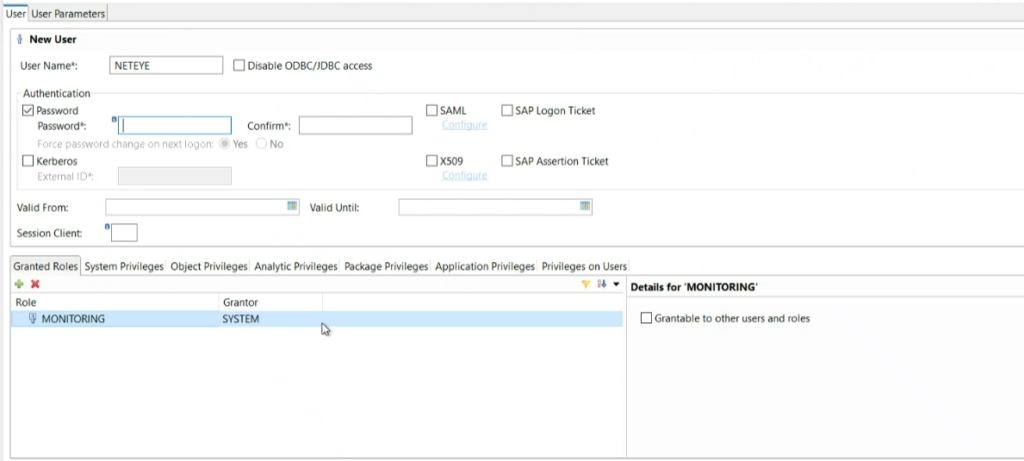
Create a user with the role MONITORING
- In SAP HANA Studio, open the SAP instance to be monitored
- Go to the “Users” section
- Create a new user with these parameters:
- username = NETEYE
- password = ***
- ROLE:
- MONITORING with grantor SYSTEM
- PUBLIC with grantor SYS
- Save the new user

You then need to install the hdbsql client on the monitoring server; you can follow this guide on SAP’s site:
https://developers.sap.com/tutorials/hxe-ua-install-hdb-client-linux..html
Test Connection
After the installation is finished you can test the SQL client to access a HANA system with this command:
./hdbsql -n 10.20.30.40 -i 21 -u NETEYE -p ***
Welcome to the SAP HANA Database interactive terminal.
Type:  \h for help with commands
       \q to quit
hdbsql PTP=>


-n <IP or host name of the hana server>
-i <instance number>
-u <username created>
-p <password>
You can also run a command line query with the -I parameter and see the result.
Test Script
The check_hana.sh script has 6 functions that execute the corresponding query to know the status of:
- connection_time
- last_backup
- failed_log_backups
- failed_data_backups
- memory_usage
- replication_status
In the example below, we launch the replication_status command to find out the replication status
'./check_hana.sh' '--function' 'replication_status' '--host' '10.20.30.40' '--user' 'NETEYE' '--pass' '***' '--port' '32***' '--sid' 'PTP'
The query that this script launches for the status of the replicas is:
SELECT host, LPAD(port, 5) port, site_name, secondary_site_name, secondary_host, LPAD(secondary_port, 5) secondary_port, replication_mode, MAP(secondary_active_status, 'YES', 1,0) secondary_active_status, MAP(UPPER(replication_status),'ACTIVE',0,'ERROR', 4, 'SYNCING',2, 'INITIALIZING',1,'UNKNOWN', 3, 99) replication_status, TO_DECIMAL(SECONDS_BETWEEN(SHIPPED_LOG_POSITION_TIME, LAST_LOG_POSITION_TIME), 10, 2) ship_delay_s, TO_DECIMAL((LAST_LOG_POSITION - SHIPPED_LOG_POSITION) * 64 / 1024 / 1024, 10, 2) async_buff_used_mb, secondary_reconnect_count, secondary_failover_count FROM sys.m_service_replication;
And the result of running the script is:
OK - Replication Status Database PTP\nHOST PORT SITE_NAME SECONDARY_SITE_NAME SECONDARY_HOST SECONDARY_PORT REPLICATION_MODE SECONDARY_ACTIVE_STATUS REPLICATION_STATUS SHIP_DELAY_S ASYNC_BUFF_USED_MB SECONDARY_RECONNECT_COUNT SECONDARY_FAILOVER_COUNT\n"lshdbttptp" "32***" "TESTINSIDE" "REPLICATE" "lshdbdrrptp" "32***" "ASYNC" 1 0 0.00 0.00 0 0\n|'ship-delay-port-32***'=0.00s;10;20;0;0The check fails if REPLICATION_MODE is different from SYNC or SYNCMEM, if the secondary site is down, or if SHIP_DELAY_S is greater than 20 seconds
With this monitoring mode you can run and monitor a very large number of HANA metrics, and have the ability to run custom queries as well.
These Solutions are Engineered by Humans
Did you find this article interesting? Does it match your skill set? Our customers often present us with problems that need customized solutions. In fact, we’re currently hiring for roles just like this and others here at Würth Phoenix.


