
Scenario
NetEye 4 provides a graphical engine to represent time series monitoring data stored in an Influx database: the Grafana engine accessible through the ITOA menu on the left hand side.
Grafana is very powerful: it consists of a dashboard built up of multiple individual panels. A lot of them are native to Grafana, but there is also a large public library of panels developed by the community:
https://grafana.com/grafana/plugins/panel-plugins/
These additional panel types can be imported into NetEye4 to create Grafana dashboards with special data rendering.
Multistat Panel
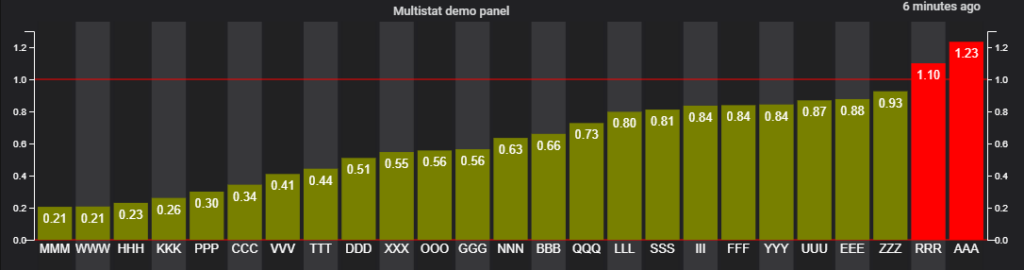
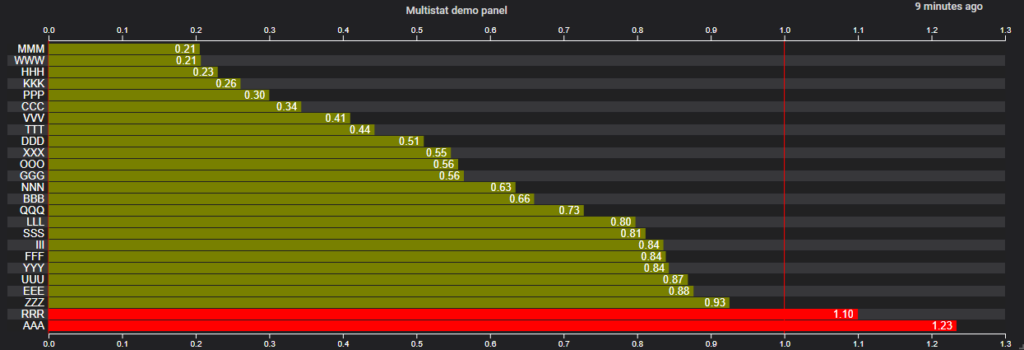
A very well-known add-on panel type is the Multistat Panel. This panel is able to render the instantaneous value of several metrics at the same time. The graphical rendering is very powerful:
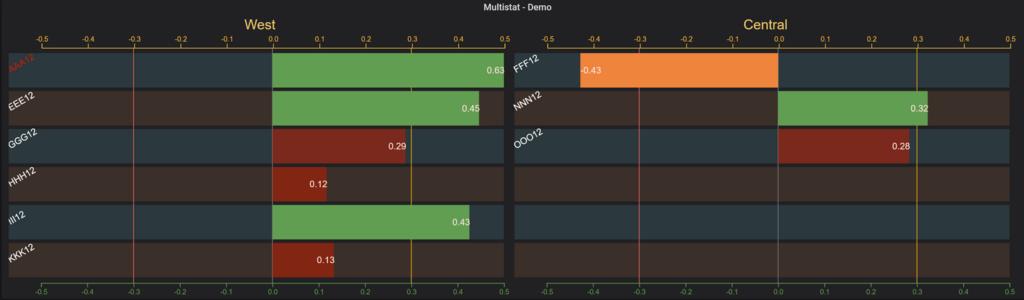
It can also be grouped and colored:
An Issue with Grafana 11
Unfortunately, Grafana 11 has dropped support for the AngularJS library, causing a large number of panels to fail:
https://grafana.com/docs/grafana/latest/developers/angular_deprecation/angular-plugins/
In that article, there’s a list of panels that no longer work, including Multistat. Luckily for each of them there is also a possible alternative listed, if one exists.
An Alternative to Multistat
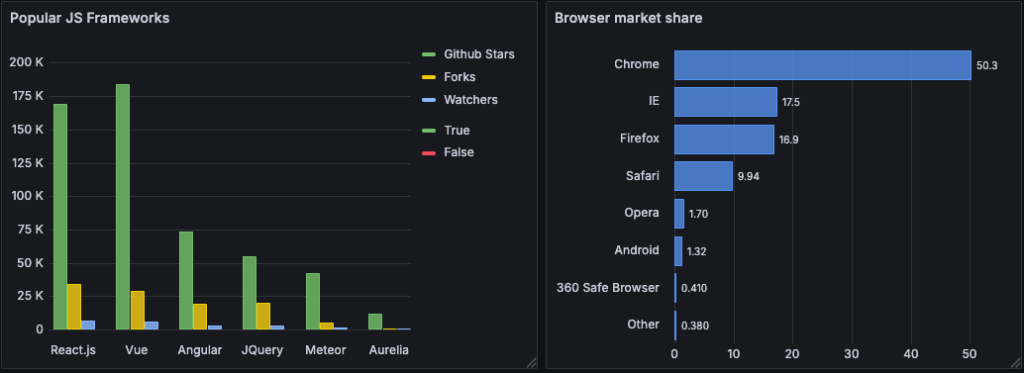
Fortunately, Grafana added a brand-new native panel named Bar chart:
https://grafana.com/docs/grafana/latest/panels-visualizations/visualizations/bar-chart/
This panel is very similar to the old Multistat panel, so with a little of effort, it’s pretty easy to configure a similar panel
Each individual case of incompatibility must be deeply analyzed separately in order to find the proper solution or workaround.
These Solutions are Engineered by Humans
Are you passionate about performance metrics or other modern IT challenges? Do you have the experience to drive solutions like the one above? Our customers often present us with problems that need customized solutions. In fact, we’re currently hiring for roles just like this as well as other roles here at Würth Phoenix.


Alessandro Romboli
Site Reliability Engineer at Würth IT Italy
My name is Alessandro and I joined Würth Phoenix (now Würth IT Italy) early in 2013. I have over 20 years of experience in the IT sector: For a long time I've worked for a big Italian bank in a very complex environment, managing the software provisioning for all the branch offices. Then I've worked as a system administrator for an international IT provider supporting several big companies in their infrastructures, providing high availability solutions and disaster recovery implementations. I've joined the VMware virtual infrastructure in early stage, since version 2: it was one of the first productive Server Farms in Italy. I always like to study and compare different technologies: I work with Linux, MAC OSX, Windows and VMWare. Since I joined Würth Phoenix, I could also expand my experience on Firewalls, Storage Area Networks, Local Area Networks, designing and implementing complete solutions for our customers. Primarily, I'm a system administrator and solution designer, certified as VMware VCP6 DCV, Microsoft MCP for Windows Server, Hyper-V and System Center Virtual Machine Manager, SQL Server, SharePoint. Besides computers, I also like photography, sport and trekking in the mountains.
Author
Latest posts by Alessandro Romboli
03. 12. 2025
Microsoft
Single Sign-On for Power BI Report Server
08. 09. 2025
Service Management
VMware ESXi Transparent Page Sharing
12. 06. 2025
Microsoft
Terminal Server User Profiles with FSLogix
05. 02. 2025
Knowledge Management, Service Management
Dynamics 365 Finance & Operations (On -Premises) Connectivity: New Authentication Model