


02. 04. 2026
NetEye, Unified Monitoring

24. 12. 2025
Damiano Chini
APM, Log-SIEM, Machine Learning, NetEye, Real User Experience
Root Cause Analysis with Elastic ML and Alyvix
When performance degradation occurs within a complex system, understanding the root cause can be extremely challenging. If the issue happens sporadically, this difficulty increases even more. This is because modern systems involve numerous components that interact in complex ways. For example, if your application’s Web UI becomes slow, the underlying cause could be anywhere in the stack.
Even if you collect observability data for all involved components, the sheer volume of information can be overwhelming, leaving you without a clear starting point for investigation.
In these cases, machines can help us. They’re far better than humans at processing and analyzing large amounts of data.
Can NetEye help us identify the root cause of these problems?
The Elastic Stack integrated with NetEye offers Machine Learning (ML) jobs that assist in analyzing observability data. These jobs can automatically detect anomalous behavior in your system, helping operators focus on what matters.
Recently, we had the opportunity to explore these Elastic Stack capabilities to pinpoint the root cause of an actual degradation occurring within NetEye itself.
Our Degradation Problem
Several users were reporting that Kibana occasionally felt slower than usual, but we couldn’t determine why or when these slowdowns occurred.
To investigate, we set up an Alyvix Test Case simulating real user behavior in Kibana. This allowed us to measure latency during the actual user journey, and identify when the degradation happened.
Shortly after deploying the Alyvix Test Case, we gathered clear evidence of the issue, as shown in the dashboard below:
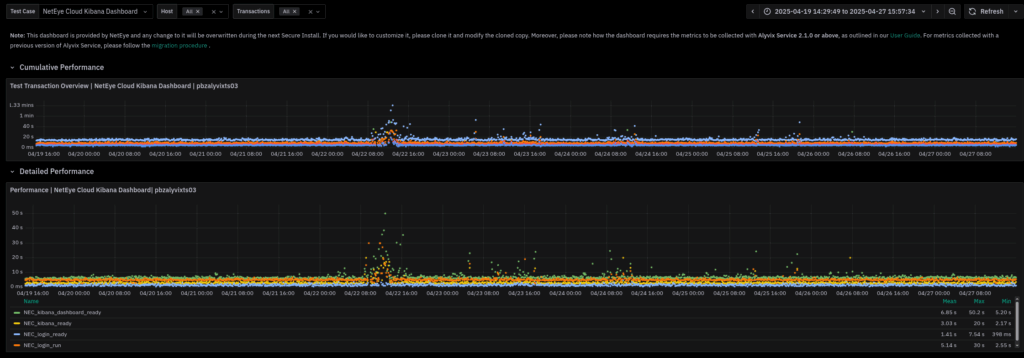
On April 22nd at around 12 PM, the test case reported a significant increase in duration. This gave us a concrete point in time to start our investigation.
But how could we determine what caused this degradation?
Elastic Machine Learning Anomaly Detection Jobs
At this stage, we knew what the degradation was and when it occurred, but not why. The components involved in delivering Kibana’s UI are the Kibana service itself and its backend, Elasticsearch. While we had monitoring data for both (provided out-of-the-box by Elastic Stack), the sheer amount of data made it nearly impossible for a human operator to manually identify correlations.
This is where Machine Learning comes to the rescue. Elastic allows you to run ML jobs on data stored in Elasticsearch, automatically highlighting time-based correlations between anomalies in your infrastructure:

In our case, Elastic ML detected anomalies in the Alyvix test case transactions (bottom row) during the morning of April 22nd. To find potential correlations, we looked for anomalies in other parameters that occurred only during this time frame, since recurring anomalies would likely cause similar issues at other times.
Following this reasoning, we noticed an anomaly in Kibana jobs processed that morning, which did not appear on other days. This was a strong indicator of the actual root cause behind Kibana’s performance degradation.
Conclusion
By combining Alyvix for real user experience monitoring with Elastic’s Machine Learning anomaly detection, we were able to identify when the degradation occurred and uncover strong indicators of its root cause. However, it’s important to note that human expertise is still essential to setting up meaningful ML jobs and interpreting the results effectively. This synergy between automated analysis and human insight can significantly reduce the root cause investigation time.
These Solutions are Engineered by Humans
Did you find this article interesting? Are you an “under the hood” kind of person? We’re really big on automation and we’re always looking for people in a similar vein to fill roles like this one as well as other roles here at Würth IT Italy.