


30. 12. 2025
Automation, Development, Log Management, Log-SIEM, NetEye

10. 03. 2026
Franco Federico
Unified Monitoring
Elastic AutoOps in NetEye: Simplifying Elasticsearch Operations with Real-Time Intelligence
Introduction
Managing Elasticsearch effectively – especially as environments grow in size and complexity – can quickly become a challenging task. Performance tuning, identifying the true root cause behind slowdowns, and optimizing resource allocation often demand specialized expertise and a significant investment in time.
In enterprise ecosystems, where observability underpins critical services and reliability expectations are high, these operational burdens translate directly into cost, risk, and service quality.
With AutoOps, Elastic is introducing a fundamentally new approach to cluster operations. This capability, now available for free across both Elastic Cloud and self-managed deployments, aims to simplify and automate tasks that have traditionally required deep technical knowledge.
AutoOps continuously analyzes hundreds of metrics from your Elasticsearch environment, providing real-time insights, automated diagnostics, optimization suggestions, and guided remediation steps – all without the need for additional infrastructure or licensing overhead.
In practice, this shifts operational management from a reactive, manual model to a far more proactive and intelligent one – reducing troubleshooting time, preventing issues before they escalate, and making day-to-day cluster administration noticeably more efficient.
What AutoOps Is and What It Solves
Elastic AutoOps introduces a far more streamlined way to optimize, troubleshoot, and operate Elasticsearch environments. Instead of relying on manual checks or deep internal knowledge.
AutoOps constantly evaluates the health of your cluster, highlights what needs attention, and guides you through the resolution with clear, actionable steps. At its core, AutoOps brings together several capabilities that simplify day-to-day operations:
- Real-time visibility into emerging issues: By continuously analyzing key performance indicators such as CPU, memory usage, disk pressure, indexing latency, slow searches, and unbalanced shard distributions, AutoOps is able to surface problems the moment they appear. [elastic.co]
- Automated root cause analysis: When the system detects a symptom – for example a drop in indexing throughput or shards skewed across nodes – AutoOps doesn’t just alert you. It also explains why it’s happening and proposes concrete remediation steps, including in-context Elasticsearch commands you can apply directly. [elastic.co]
- Performance and cost optimization: Beyond troubleshooting, AutoOps identifies inefficient data structures, misconfigurations, or underutilized resources and provides recommendations to improve performance while helping reduce unnecessary hardware consumption. [nand-research.com]
- Integrated alerting and notifications: To support operational workflows, AutoOps can forward insights and alerts to collaboration and incident-management platforms such as Slack, Microsoft Teams, PagerDuty, or custom webhooks. [elastic.co]
What emerges is a solution that makes Elasticsearch operations more predictable, more efficient, and significantly less time-consuming – particularly for teams managing large or business-critical environments.
How AutoOps Works
AutoOps operates in three primary phases:
A. Metrics Collection
Elastic Agent collects telemetry from your cluster and sends it securely to Elastic Cloud. AutoOps currently supports Elasticsearch 7.17.x and above. [elastic.co]
B. Analysis Engine
The AutoOps backend compares collected metrics against known patterns of:
- Ingestion bottlenecks
- Shard imbalance
- Search latency
- Template/mapping misconfigurations
- High memory/CPU pressure
- Queue saturation
These detections are backed by Elastic’s acquired Opster technology – specialized in Elasticsearch operational intelligence. [nand-research.com]
C. Recommendations & Resolution
When issues arise, AutoOps provides:
- Root-cause analysis
- Explanations of what happened and why
- Suggested commands to fix the problem
Key Features in Depth
✔ Cluster Status & Node-Level Insights
AutoOps highlights failing nodes, oversized shards, memory pressures, and misconfigurations. This allows admins to intervene before incidents turn into outages. [elastic.co]
✔ Indexing & Search Performance Analysis
It detects:
- High indexing queues
- Search latency spikes
- Rejected indexing operations
- Slow queries
- Data structure inefficiencies [elastic.co]
✔ Resource Utilization Optimization
AutoOps identifies:
- Over-provisioned nodes
- CPU/memory waste
- Oversized heap settings
- Excessive shard counts [nand-research.com]
✔ Multi-Cluster Dashboard
If you operate multiple deployments (Cloud, ECK, ECE, self-managed), AutoOps provides a centralized view to compare and detect anomalies. [elastic.co]
Availability and Licensing
AutoOps is currently available for:
- Elastic Cloud Hosted
- Elastic Cloud Serverless
- ECK (Elastic Cloud on Kubernetes)
- ECE (Elastic Cloud Enterprise)
- All self-managed clusters using Cloud Connect (newly free) [elastic.co]
It’s not available for:
- Air-gapped environments (future local deploy option planned) [elastic.co]
Cost:
- 100% free
- Does not consume ECUs on Elastic Cloud
- Free for all license tiers, including self-managed [elastic.co]
Preparing a Live Test Environment
As part of evaluating how realistic and valuable AutoOps can be in a production-like scenario, I decided to build a small but meaningful test environment. The idea is to replicate a typical NetEye-based Elasticsearch setup and observe how AutoOps behaves when connected to a test environment.
Step 1 – Prepare the Elasticsearch Test Single node
To begin, I deployed a fresh instance of NetEye 4.46 running Elastic Stack 9.2.6. Alongside it, I set up a Rocky Linux client, which I will use as the host for the Elastic Agent responsible for collecting metrics and sending them to Elastic Cloud. This keeps the NetEye system clean while still enabling full visibility for AutoOps.
Step 2 – Connect the Cluster to AutoOps
Following Elastic’s official workflow:
1. Log into Elastic Cloud
2. Go to Connected Clusters → Connect Self-Managed Cluster
3. The wizard will guide installation of Elastic Agent (via Linux, Docker, Kubernetes, or ECK), in my case Linux:
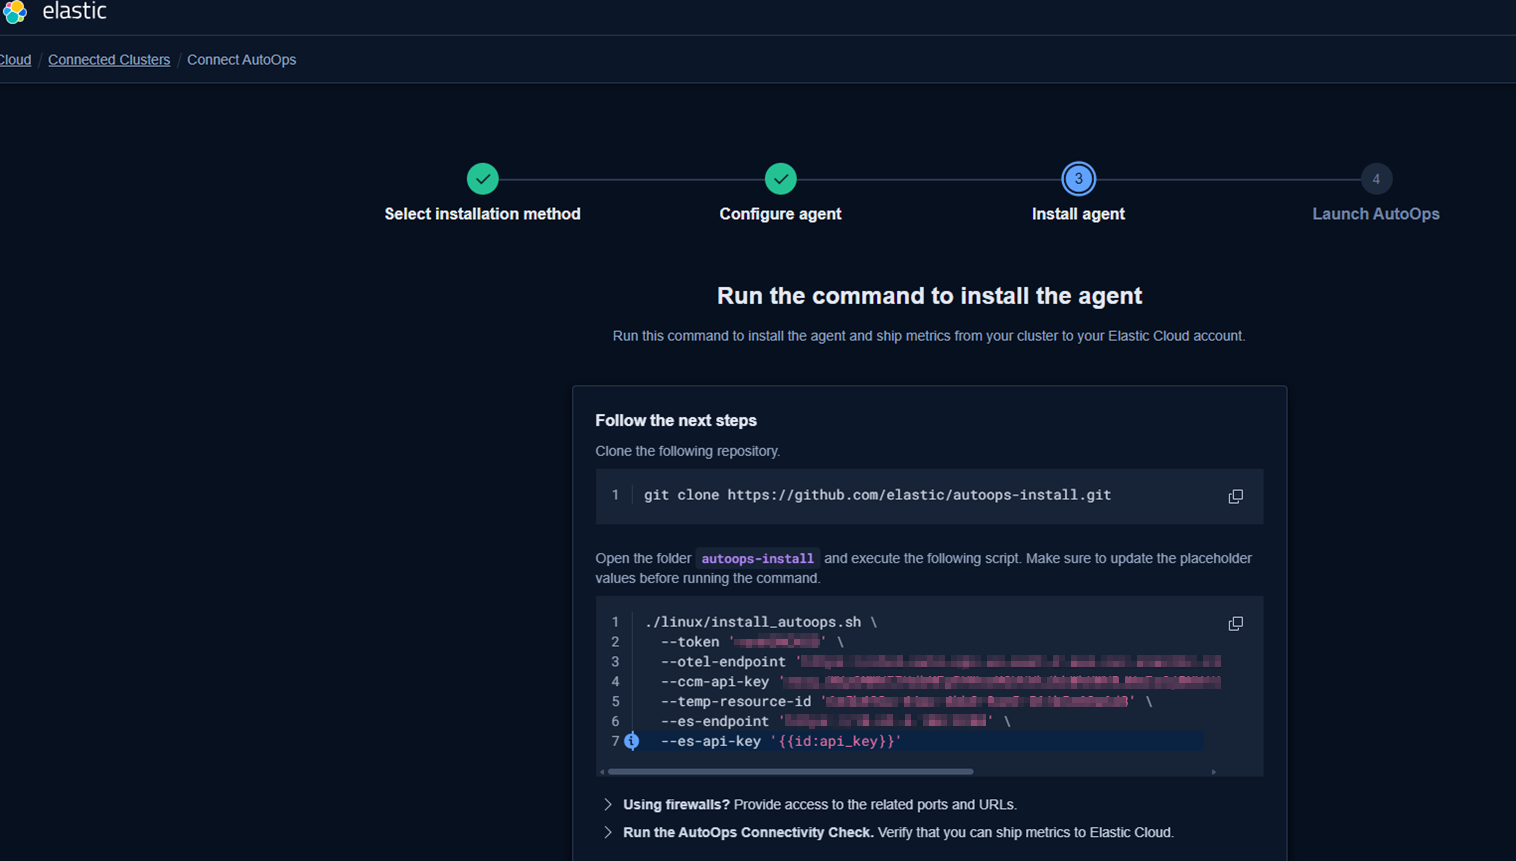
4. Ensure outbound network connectivity for metrics shipment to Elastic Cloud
[elastic.co]
After completing the enrollment, the agent begins collecting data from the NetEye Elasticsearch node and streams it to AutoOps.
Step 3 – Watch the result
After a while you’ll see this:
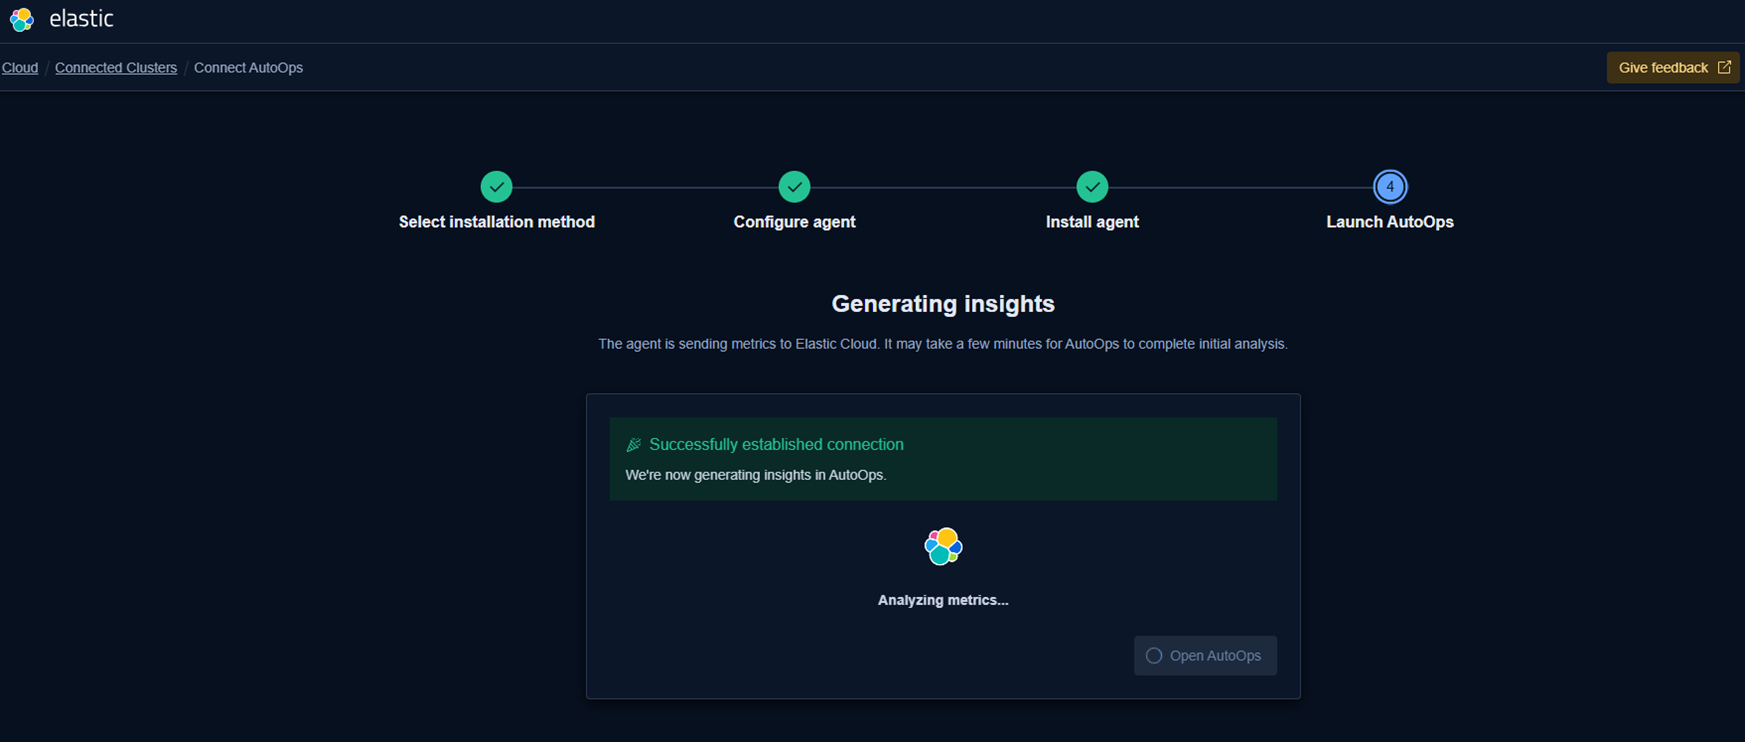
AutoOps starts analyzing the cluster and presents the first insights:
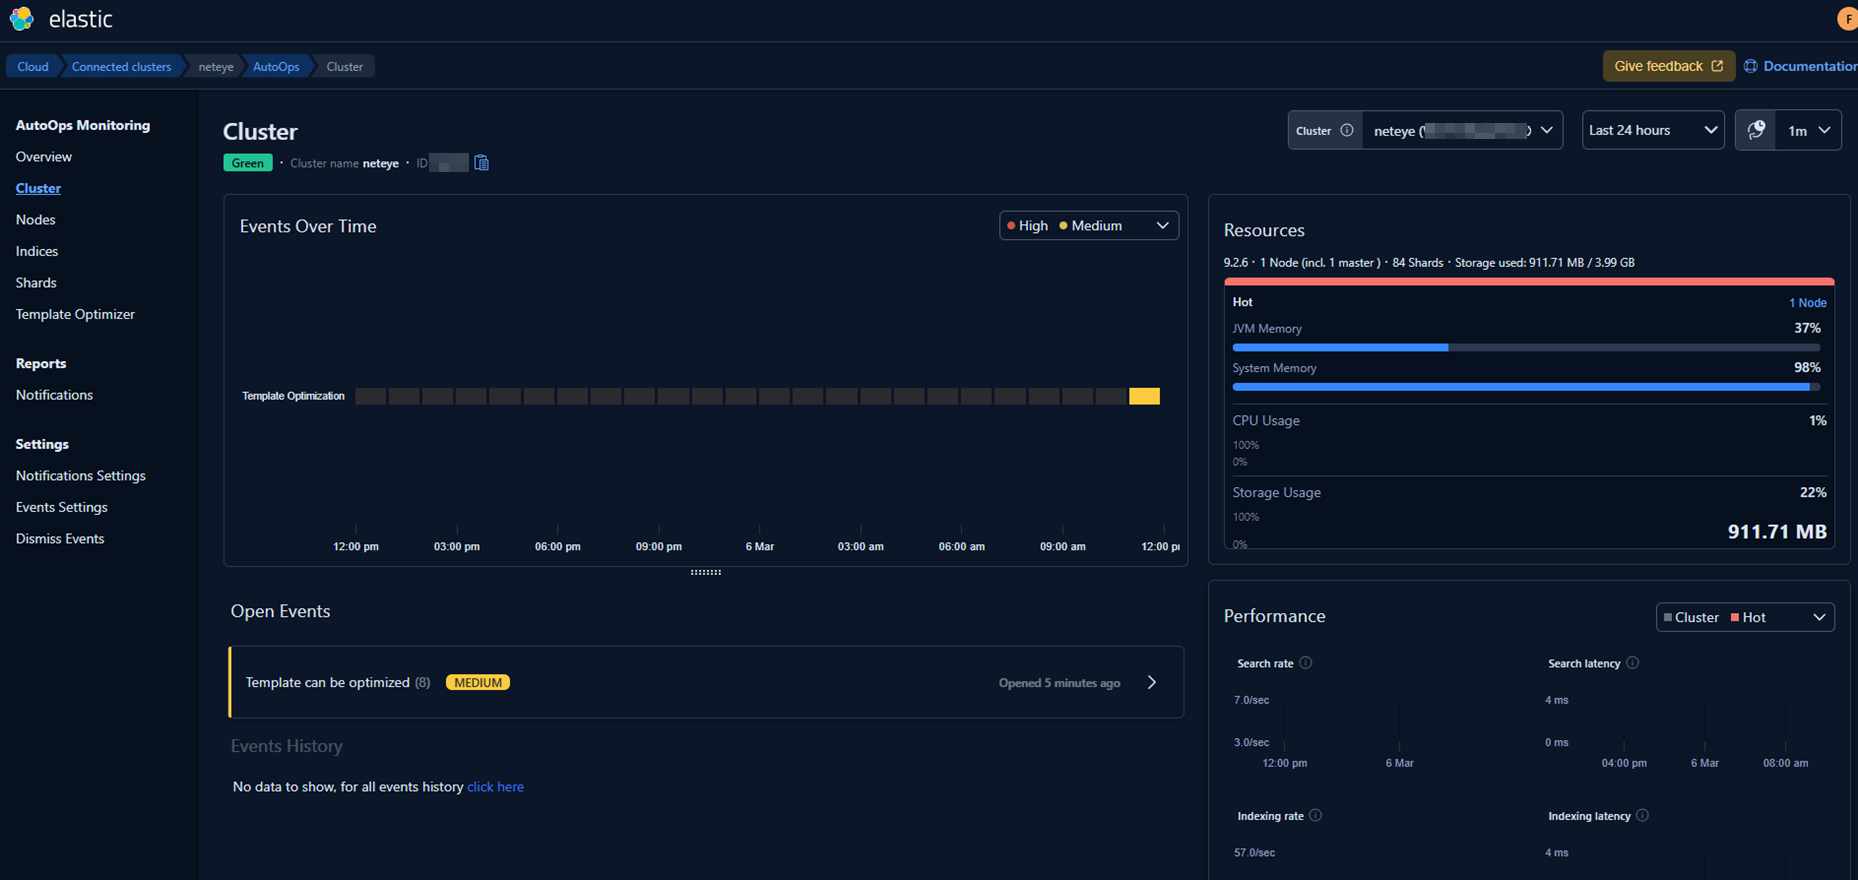
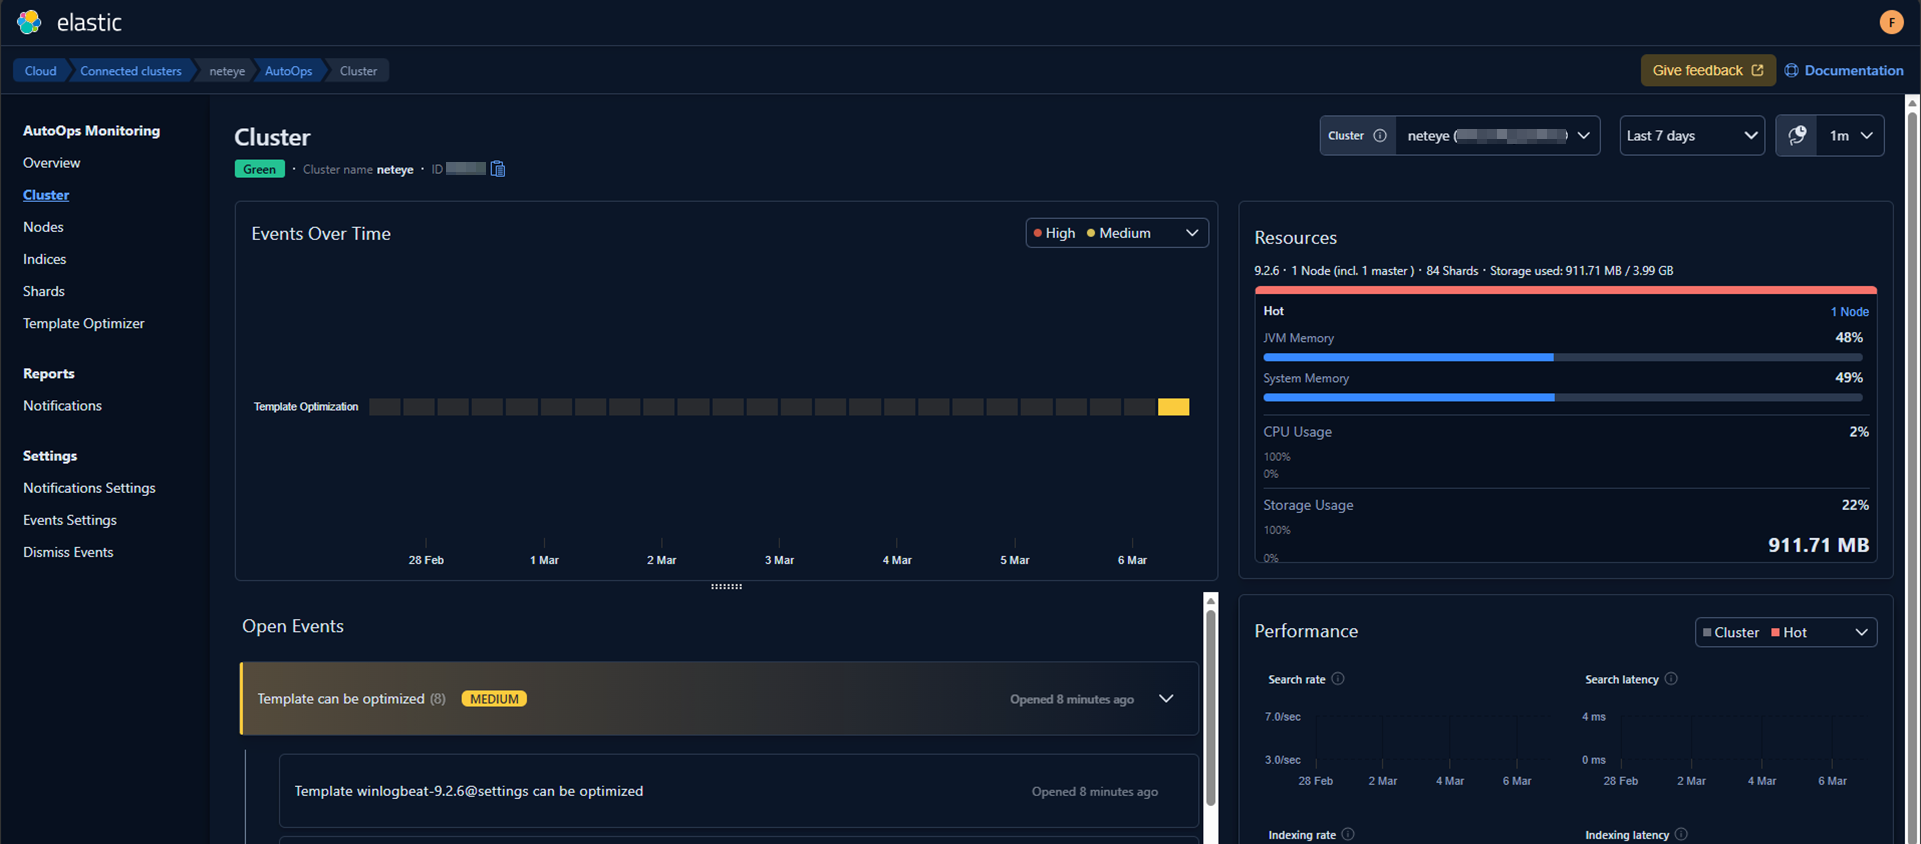
Since this is a completely fresh environment, it initially lacks some of our usual templates and configuration standards. AutoOps immediately highlights these gaps and suggests corrective actions.
So I fixed those with the following suggestions:
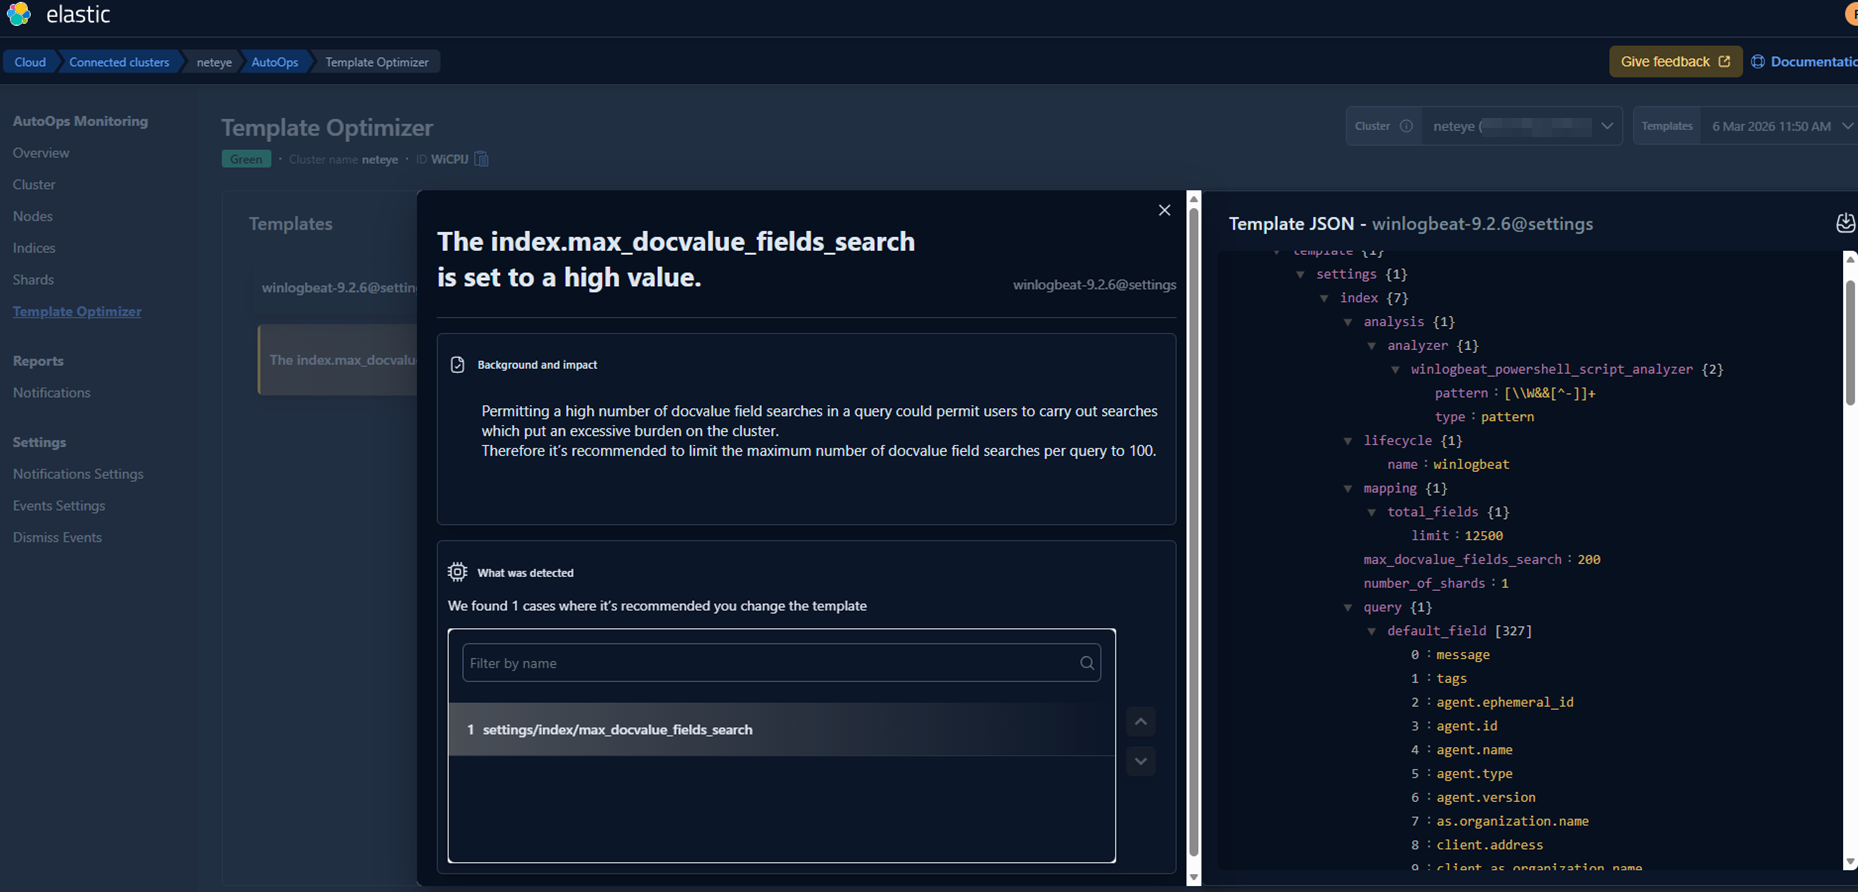
And then in my environment I set the new value on all templates.
A quick restart of the Elastic Agent on Rocky Linux allowed the system to pick up the changes in real time. (Alternatively, AutoOps would have incorporated the updates automatically after a little while.)
What Comes Next
The next stage of this evaluation could focus on a real production‑like environment and/or on simulating realistic operational scenarios, such as:
- Running indexing workloads with large documents
- Intentionally creating a shard imbalance
- Triggering slow or heavy queries
- Pushing ingestion spikes and burst loads
In addition to these technical stress tests, I’m also planning to explore how AutoOps notifications can be natively integrated into NetEye, leveraging our existing alerting and event‑handling ecosystem. This would allow operational insights produced by AutoOps to flow directly into NetEye’s monitoring environment, making the entire troubleshooting and remediation process even more seamless.
Conclusion
Elastic AutoOps adds an interesting new dimension to the way we can operate Elasticsearch clusters within NetEye. Thanks to the Enterprise features already available in NetEye, we have the flexibility to experiment with advanced capabilities like AutoOps and evaluate how they can complement our existing monitoring, alerting, and observability workflows.
This first exploration was only a starting point – a way to understand how AutoOps behaves when connected to a clean, freshly installed NetEye environment. In upcoming posts, I plan to dive more deeply into these topics and explore how AutoOps can be combined with NetEye’s built‑in features, including the possibility of integrating its notifications directly into our event management workflows.
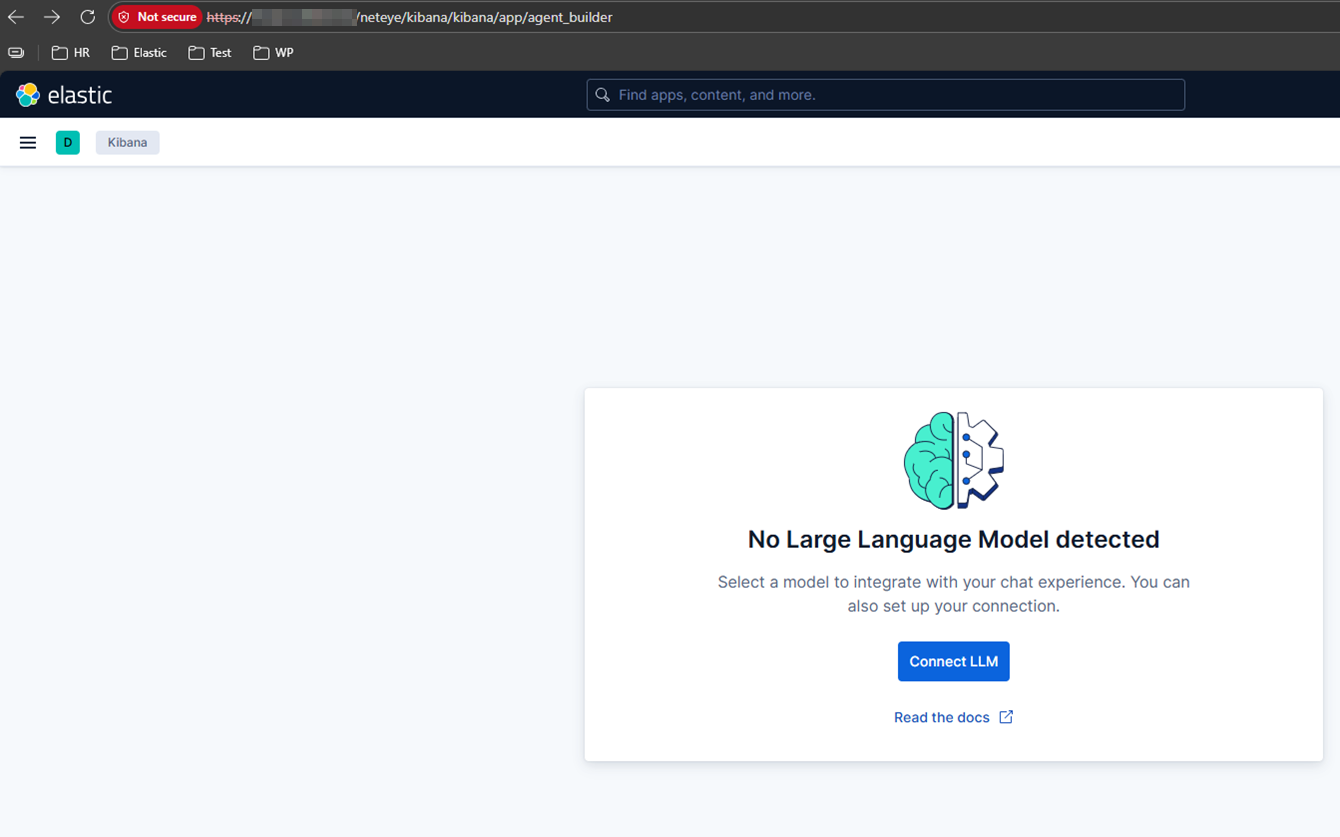
At the same time, with the release of the new Elastic Stack 9.3, which will also be available in the upcoming NetEye 4.47, there will be even more opportunities to test new components, compare behaviors, and understand how these innovations can improve day‑to‑day operational efficiency. One of the best would be Chat with your data: building custom AI agents, based on different connectors on different public AI systems. Here’s a preview image:
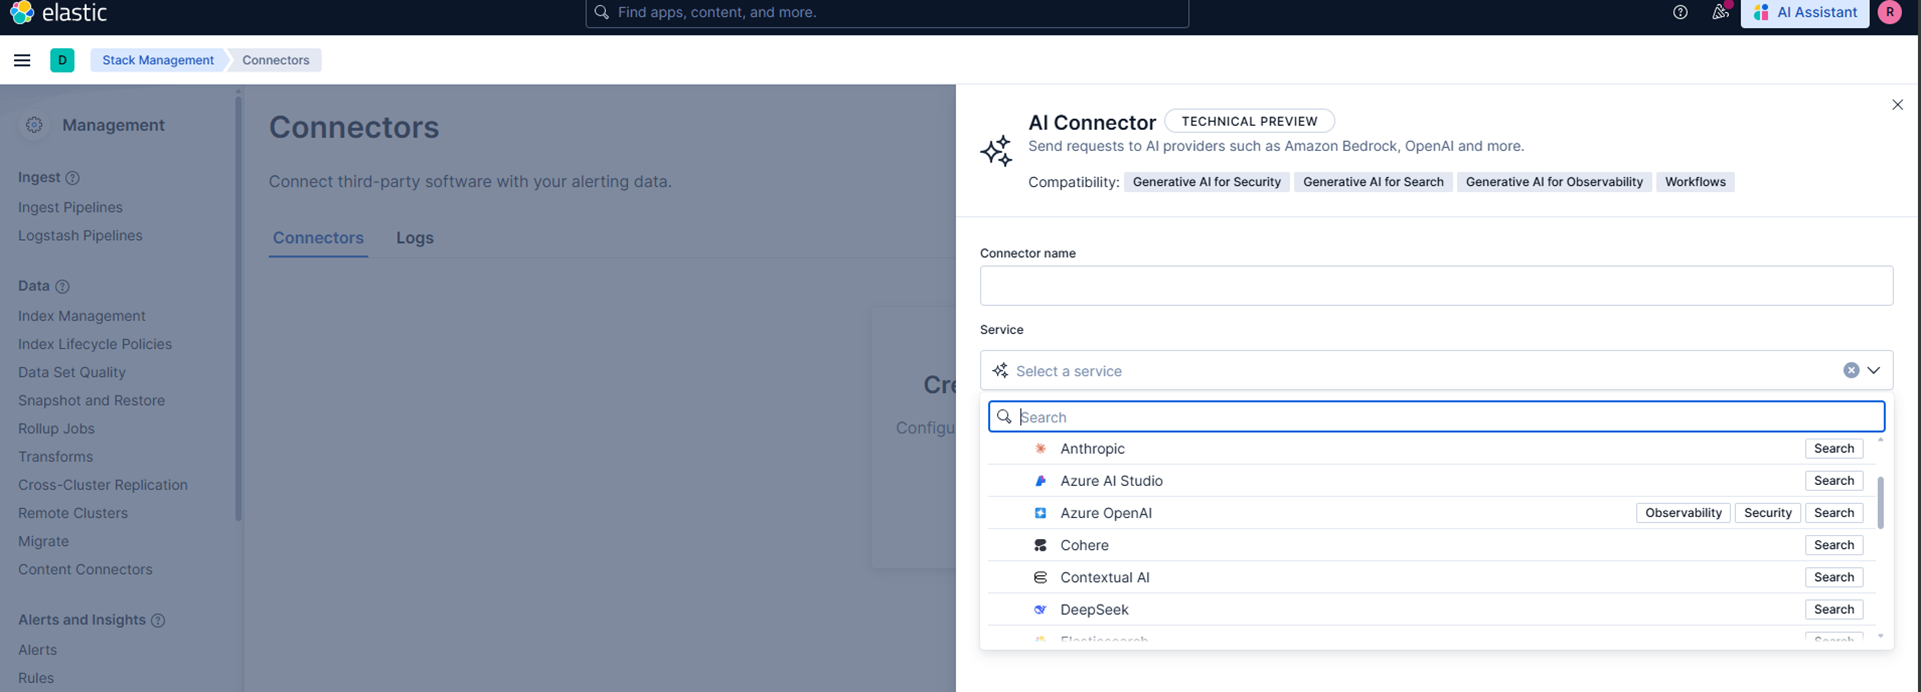
And here’s another preview:
There’s still a lot to explore – and I’m looking forward to sharing the next steps of this incredible journey.
These Solutions are Engineered by Humans
Did you find this article interesting? Does it match your skill set? Our customers often present us with problems that need customized solutions. In fact, we’re currently hiring for roles just like this and others here at Würth IT Italy.
Franco Federico
Hi, I’m Franco and I was born in Monza. For 20 years I worked for IBM in various roles. I started as a customer service representative (help desk operator), then I was promoted to Windows expert. In 2004 I changed again and was promoted to consultant, business analyst, then Java developer, and finally technical support and system integrator for Enterprise Content Management (FileNet). Several years ago I became fascinated by the Open Source world, the GNU\Linux operating system, and security in general. So for 4 years during my free time I studied security systems and computer networks in order to extend my knowledge. I came across several open source technologies including the Elastic stack (formerly ELK), and started to explore them and other similar ones like Grafana, Greylog, Snort, Grok, etc. I like to script in Python, too. Then I started to work in Würth Phoenix like consultant. Two years ago I moved with my family in Berlin to work for a startup in fintech(Nuri), but the startup went bankrupt due to insolvency. No problem, Berlin offered many other opportunities and I started working for Helios IT Service as an infrastructure monitoring expert with Icinga and Elastic, but after another year I preferred to return to Italy for various reasons that we can go into in person 🙂 In my free time I continue to dedicate myself to my family(especially my daughter) and I like walking, reading, dancing and making pizza for friends and relatives.
Author
Latest posts by Franco Federico
09. 09. 2025
NetEye
Backing up a MariaDB Galera Cluster
12. 06. 2025
NetEye, Unified Monitoring
From Monitoring to SOC
17. 02. 2025
Unified Monitoring
Monitoring Printer Logs
10. 12. 2024
Log-SIEM
Let’s Discover ES|QL