


31. 03. 2026
Atlassian, Service Management

02. 04. 2026
Daniel Vedovato
NetEye, Unified Monitoring
Monitoring Ollama in NetEye with ollama-metrics and check_prometheus

Running Ollama locally or on dedicated hardware is straightforward until you need to know whether a model is actually loaded in RAM, how fast it generates tokens under load, or when memory consumption reaches a threshold that affects other workloads. A simple TCP port check confirms the process is alive, nothing more.
This tutorial shows how to expose Prometheus metrics from Ollama using the ollama-metrics sidecar, scrape them into a dedicated Prometheus instance, and turn the result into proper Icinga service checks in NetEye using check_prometheus.
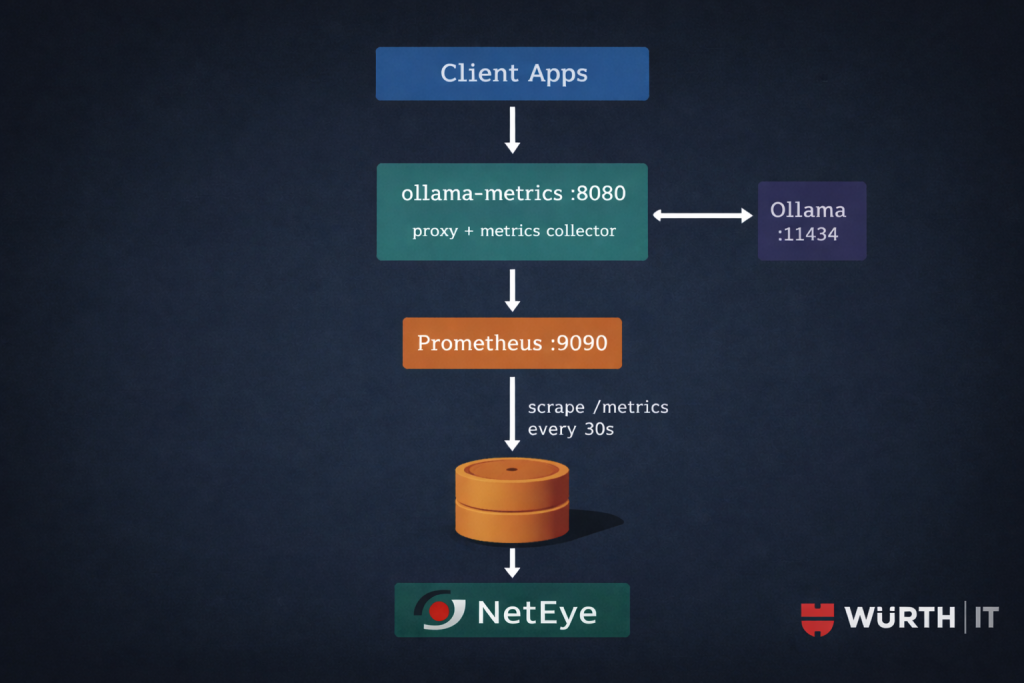
Architecture
ollama-metrics runs as a transparent HTTP proxy in front of Ollama. It forwards every request upstream and instruments the response stream: token counts, request duration, time-per-token. It also polls the Ollama API at /api/ps on every /metrics scrape to collect loaded model state and RAM allocation.
Two constraints worth noting up front. First, ollama-metrics is proxy-only: there is no standalone polling mode. The process must sit between your applications and Ollama to capture per-request metrics. If you run it without routing traffic through it, you still get model state and RAM from /api/ps, but you lose token counts and latency histograms entirely. Second, routing through an extra hop adds a small amount of latency and a single point of failure: assess whether this is acceptable for your deployment before putting it on a critical inference path.
Prerequisites
- Ollama running and reachable from the host where
ollama-metricswill run - Docker on the Ollama host for
ollama-metricsand Prometheus check_prometheusbinary installed on the NetEye satellite or master that will execute the checks- Icinga Director access (REST API or Web UI) with permission to create CheckCommands and Services
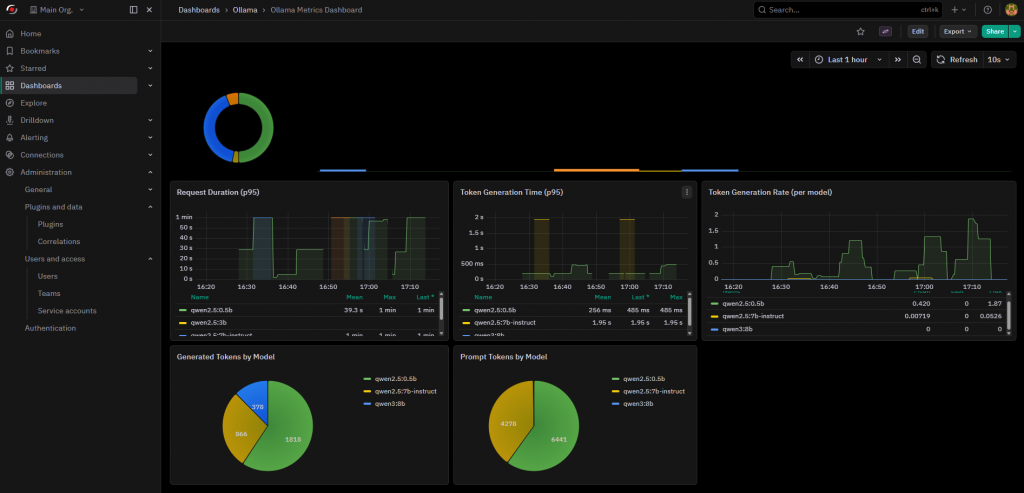
A note on Prometheus: NetEye uses InfluxDB as its native metrics backend, not Prometheus. To use check_prometheus, you need a separate Prometheus instance that scrapes ollama-metrics. The simplest option is a lightweight container running on the same host as Ollama or on a dedicated monitoring host. NetEye’s Grafana can then be pointed at this Prometheus as an additional data source if you want dashboards alongside the Icinga checks.
Optional: the ollama-metrics repository already includes a Grafana dashboard you can import directly: dashboard.json.
Step 1: Deploy ollama-metrics
Run the sidecar on the same host as Ollama. Redirect your applications from port 11434 to port 8080: the proxy is fully transparent and returns unmodified responses.
docker run -d \
  --name ollama-metrics \
  --restart unless-stopped \
  -e OLLAMA_HOST=http://localhost:11434 \
  -e PORT=8080 \
  --network host \
  ghcr.io/norskhelsenett/ollama-metrics:latest
--network host lets the container reach Ollama on localhost without extra bridge configuration. If Ollama runs on a separate host, replace OLLAMA_HOST with the appropriate address.
Verify the metrics endpoint is up:
curl -s http://localhost:8080/metrics | grep ollama_
Expected output when at least one model is loaded:
# HELP ollama_generated_tokens_total Total number of generated tokens
# TYPE ollama_generated_tokens_total counter
ollama_generated_tokens_total{model="llama3.2:3b"} 14372
# HELP ollama_loaded_models Number of models currently loaded
# TYPE ollama_loaded_models gauge
ollama_loaded_models 1
# HELP ollama_model_loaded Whether a specific model is loaded (1) or not (0)
# TYPE ollama_model_loaded gauge
ollama_model_loaded{model="llama3.2:3b"} 1
# HELP ollama_model_ram_mb RAM used by each loaded model in MB
# TYPE ollama_model_ram_mb gauge
ollama_model_ram_mb{model="llama3.2:3b"} 2048
# HELP ollama_prompt_tokens_total Total number of prompt tokens processed
# TYPE ollama_prompt_tokens_total counter
ollama_prompt_tokens_total{model="llama3.2:3b"} 3819
If ollama_loaded_models stays at 0, confirm that OLLAMA_HOST is reachable from inside the container and that at least one model has been loaded:
curl http://localhost:11434/api/ps
Step 2: Deploy Prometheus
Create a working directory for the Prometheus configuration and compose file on the host that will run Prometheus. This can be the Ollama host itself or a separate monitoring host with network access to <OLLAMA_HOST>.
# docker-compose.yml
services:
  prometheus:
    image: prom/prometheus:latest
    restart: unless-stopped
    ports:
      - "9090:9090"
    volumes:
      - ./prometheus.yml:/etc/prometheus/prometheus.yml:ro
      - prometheus_data:/prometheus

volumes:
  prometheus_data:
# prometheus.yml
global:
  scrape_interval: 30s
  evaluation_interval: 30s

scrape_configs:
  - job_name: "ollama"
    static_configs:
      - targets:
          - "<OLLAMA_HOST>:8080"
        labels:
          instance: "ollama-01"
To monitor multiple Ollama instances, add them as additional entries under targets. Each will appear as a distinct target in Prometheus with its own instance label.
docker compose up -d
Confirm Prometheus is scraping correctly:
curl -s 'http://localhost:9090/api/v1/query?query=ollama_loaded_models' \
  | jq .data.result
You can also check Status > Targets in the Prometheus UI at http://<PROMETHEUS_HOST>:9090 and verify the ollama job shows state UP.
Step 3: Install check_prometheus
Download the v0.7.0 binary and place it in the NetEye monitoring plugins directory on the NetEye satellite or master that will run the checks:
curl -sL \
  "https://github.com/NETWAYS/check_prometheus/releases/download/v0.7.0/check_prometheus_v0.7.0_Linux_x86_64" \
  -o /usr/lib64/neteye/monitoring/plugins/check_prometheus

chmod 755 /usr/lib64/neteye/monitoring/plugins/check_prometheus
Test the health check and a sample query against your Prometheus instance before touching Director:
/usr/lib64/neteye/monitoring/plugins/check_prometheus health \
  --hostname <PROMETHEUS_HOST> --port 9090

/usr/lib64/neteye/monitoring/plugins/check_prometheus query \
  --hostname <PROMETHEUS_HOST> --port 9090 \
  --query 'ollama_loaded_models' \
  --critical '@0:0'
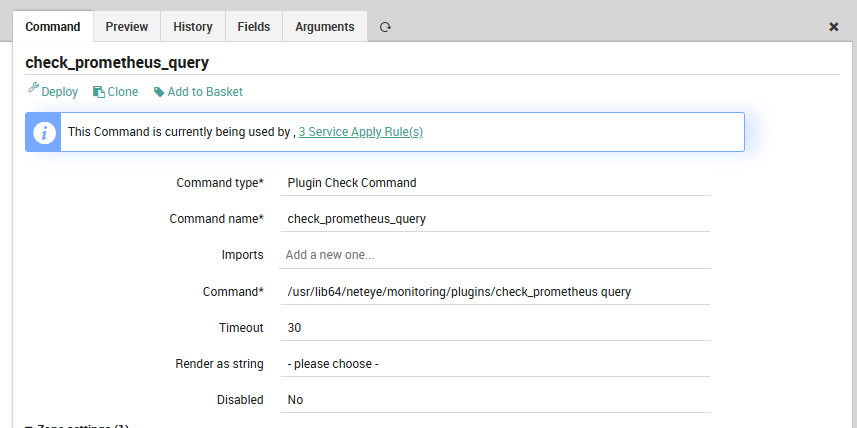
Step 4: Define the CheckCommand in Icinga Director
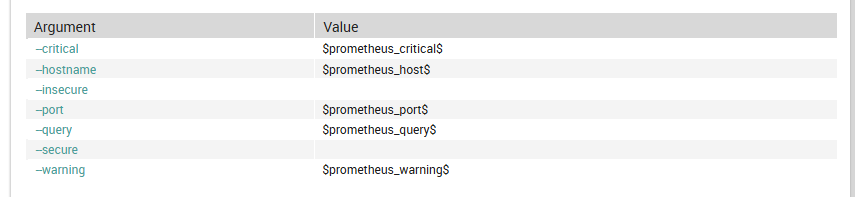
Create the CheckCommand via the Director REST API. This definition exposes all relevant flags as custom variables so you can override them per host or per service without touching the command object.
curl -sk -u admin:<PASSWORD> \
  -X POST https://<NETEYE_HOST>/neteye/director/command \
  -H "Accept: application/json" \
  -H "Content-Type: application/json" \
  -d '{
    "object_name": "check_prometheus_query",
    "object_type": "object",
    "command": "/usr/lib64/neteye/monitoring/plugins/check_prometheus query",
    "command_type": "PluginCheck",
    "timeout": "30",
    "arguments": {
      "--hostname": {
        "value": "$prometheus_host$",
        "description": "Prometheus hostname or IP"
      },
      "--port": {
        "value": "$prometheus_port$",
        "description": "Prometheus port"
      },
      "--query": {
        "value": "$prometheus_query$",
        "required": true,
        "description": "PromQL query string"
      },
      "--warning": {
        "value": "$prometheus_warning$",
        "description": "Warning threshold (Nagios format)"
      },
      "--critical": {
        "value": "$prometheus_critical$",
        "description": "Critical threshold (Nagios format)"
      },
      "--secure": {
        "set_if": "$prometheus_secure$",
        "description": "Use HTTPS"
      },
      "--insecure": {
        "set_if": "$prometheus_insecure$",
        "description": "Skip TLS verification"
      }
    },
    "vars": {
      "prometheus_host": "<PROMETHEUS_HOST>",
      "prometheus_port": "9090"
    }
  }'
Step 5: Create the service checks
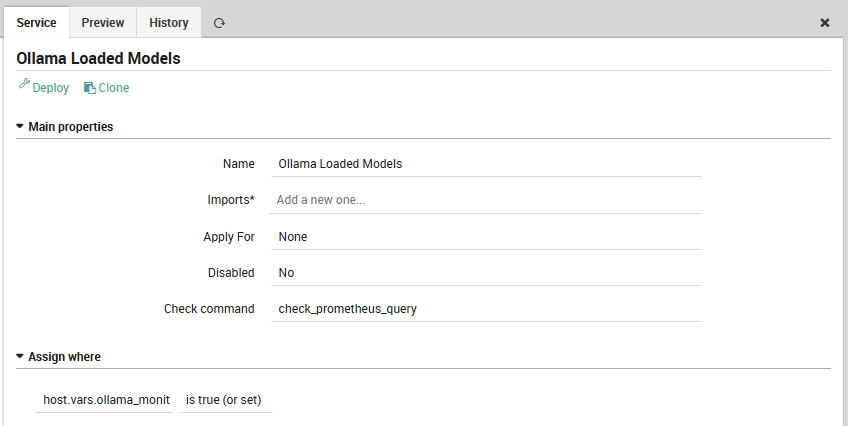
All three services use host.vars.ollama_monitored == true as the assignment filter. Tag a host once and the checks appear automatically on deployment.
Models loaded in RAM
Fires when Ollama has evicted all models from memory.
curl -sk -u admin:<PASSWORD> \
  -X POST https://<NETEYE_HOST>/neteye/director/service \
  -H "Accept: application/json" \
  -H "Content-Type: application/json" \
  -d '{
    "object_name": "Ollama Loaded Models",
    "object_type": "apply",
    "check_command": "check_prometheus_query",
    "check_interval": "60",
    "retry_interval": "30",
    "max_check_attempts": "3",
    "vars": {
      "prometheus_query": "ollama_loaded_models",
      "prometheus_critical": "@0:0"
    },
    "assign_filter": "host.vars.ollama_monitored == true"
  }'
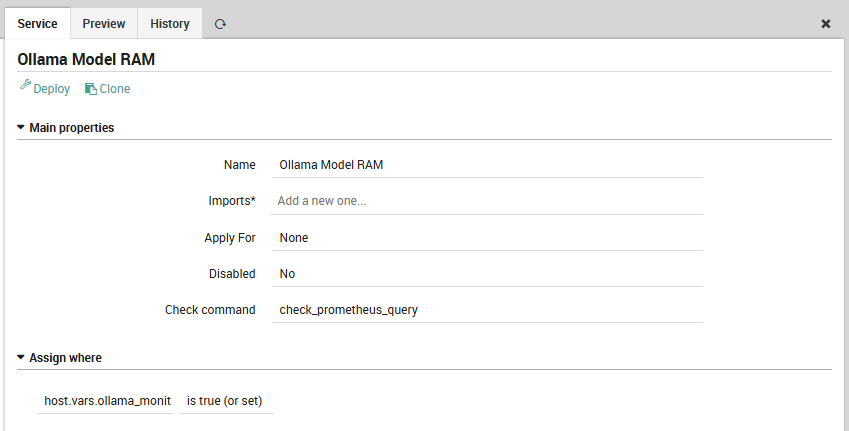
Model RAM consumption
Useful on hosts where Ollama shares memory with other workloads. The example below targets a 32 GB machine and warns at 24 GB (75%), going critical at 30 GB (93%). Adjust the thresholds to match your hardware.
curl -sk -u admin:<PASSWORD> \
  -X POST https://<NETEYE_HOST>/neteye/director/service \
  -H "Accept: application/json" \
  -H "Content-Type: application/json" \
  -d '{
    "object_name": "Ollama Model RAM",
    "object_type": "apply",
    "check_command": "check_prometheus_query",
    "check_interval": "120",
    "retry_interval": "60",
    "max_check_attempts": "2",
    "vars": {
      "prometheus_query": "sum(ollama_model_ram_mb)",
      "prometheus_warning": "24576",
      "prometheus_critical": "30720"
    },
    "assign_filter": "host.vars.ollama_monitored == true"
  }'
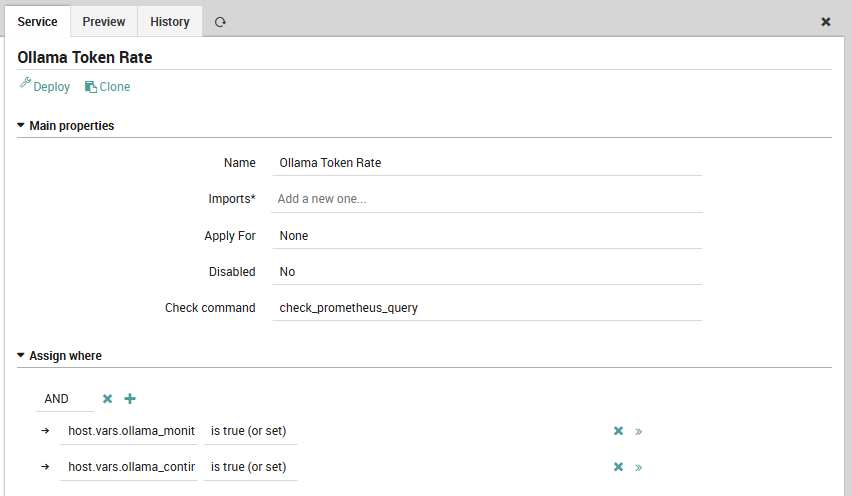
Token generation rate
Tracks inference throughput as a one-minute rate derived from the counter. A sustained drop to zero during expected usage indicates that requests are either not reaching the proxy or generation is stalling on the Ollama side. This check is scoped to hosts with ollama_continuous_traffic == true: on on-demand instances that are idle for hours at a time, a zero rate is expected and this check would produce constant noise.
curl -sk -u admin:<PASSWORD> \
  -X POST https://<NETEYE_HOST>/neteye/director/service \
  -H "Accept: application/json" \
  -H "Content-Type: application/json" \
  -d '{
    "object_name": "Ollama Token Rate",
    "object_type": "apply",
    "check_command": "check_prometheus_query",
    "check_interval": "60",
    "retry_interval": "30",
    "max_check_attempts": "3",
    "vars": {
      "prometheus_query": "sum(rate(ollama_generated_tokens_total[1m]))",
      "prometheus_critical": "@0:0"
    },
    "assign_filter": "host.vars.ollama_monitored == true && host.vars.ollama_continuous_traffic == true"
  }'
Tag the host and deploy
Set the required custom variables on each Ollama host object. Set ollama_continuous_traffic to true only on instances that run sustained inference workloads.
curl -sk -u admin:<PASSWORD> \
  -X PUT "https://<NETEYE_HOST>/neteye/director/host?name=<OLLAMA_HOST>" \
  -H "Accept: application/json" \
  -H "Content-Type: application/json" \
  -d '{
    "vars": {
      "ollama_monitored": true,
      "ollama_continuous_traffic": false
    }
  }'

curl -sk -u admin:<PASSWORD> \
  -X POST https://<NETEYE_HOST>/neteye/director/config/deploy \
  -H "Accept: application/json"
Validation
After deployment, the check output for a healthy instance looks like:
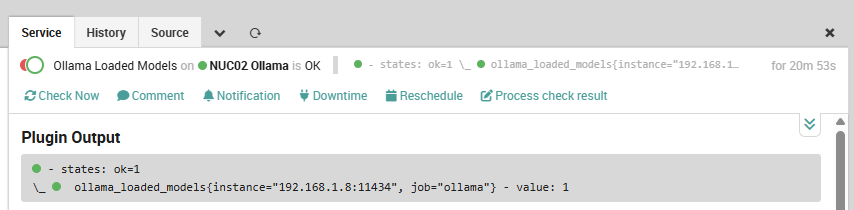
The perfdata values feed into NetEye’s Grafana automatically if you add the Prometheus instance as a Grafana data source: no extra instrumentation is needed to get time-series graphs of loaded models, RAM usage, and token throughput alongside your Icinga service state.
Takeaways
ollama-metricsrequires proxy mode to capture token counts and latency: model state and RAM come from/api/pspolling and are available even without proxied traffic, but routing your applications through port8080is the only way to get the full picturecheck_prometheus queryaccepts full PromQL, so you can extend these checks with per-model granularity, P95 latency from theollama_request_duration_secondshistogram, or model-specific token rates without touching the CheckCommand definition- The
applyfilter approach withhost.vars.ollama_monitoredkeeps Director clean: adding a new Ollama node requires only a one-line vars change and a deploy - The token rate check is a workload signal, not a health signal: gate it with a dedicated host variable so it does not fire on idle instances
- NetEye uses InfluxDB as its native metrics backend; Prometheus is entirely external to NetEye in this setup, which means you own its lifecycle and can evolve it independently of NetEye upgrades
These Solutions are Engineered by Humans
Did you find this article useful? Observability for local LLM infrastructure is still an unsolved problem for most teams, and getting it right early pays off as deployments scale. We are always looking for people who enjoy building monitoring solutions at the intersection of AI infrastructure and enterprise operations. Check out our open positions at wuerth-it.it.
Daniel Vedovato
I'm a NOC Engineer at Würth IT Italy, where I work on critical infrastructure monitoring and automation.
Before joining Würth IT, I spent nearly seven years managing ICT infrastructure at an international airport. This experience gave me a solid grounding in high-availability systems and the kind of monitoring that actually matters when things go wrong at 3 AM.
My day-to-day revolves around Icinga, NetEye, and making monitoring pipelines smarter and less noisy. I'm also deeply interested in the practical side of running AI infrastructure on-premises and integrating it into existing observability stacks.