30. 06. 2026
Azure, Cloud, Microsoft, NetEye, NetEye Extension Packs, Unified Monitoring

In the first part we created hosts and services to monitor a sequence of script using Tornado.
The Tornado Rule
Now let’s continue with the creation of a Tornado rule: open the NetEye web interface and select Tornado dashboard, then open the processing tree and select Edit mode On.
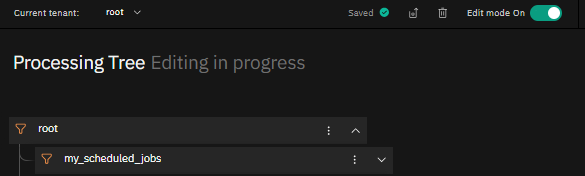
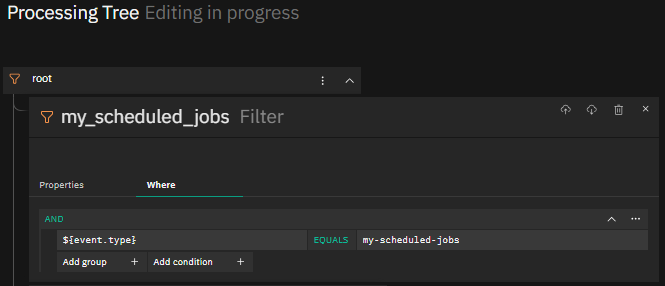
Add a filter with an appropriate name (my_scheduled_jobs) and set the Where clause: in this case the filter will work when the event-type my-scheduled-jobs arrives at Tornado.
Now select the filter and add a rule set (using the three-dots button).
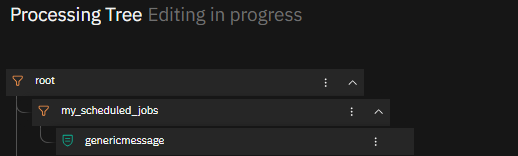
As you can see, our rule set is very simple: it’s a genericmessage because we want to load every type of description for our script results.
Now add an Icinga 2 rule type configured to process the messages sent by our scripts:
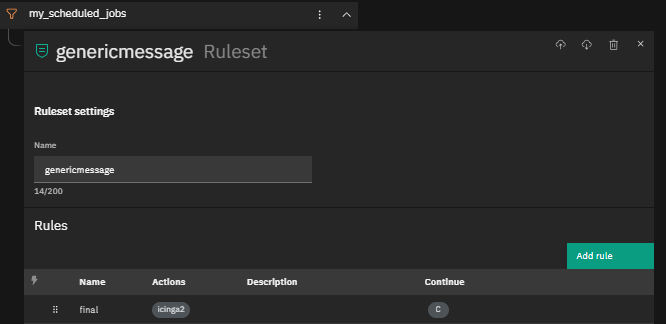
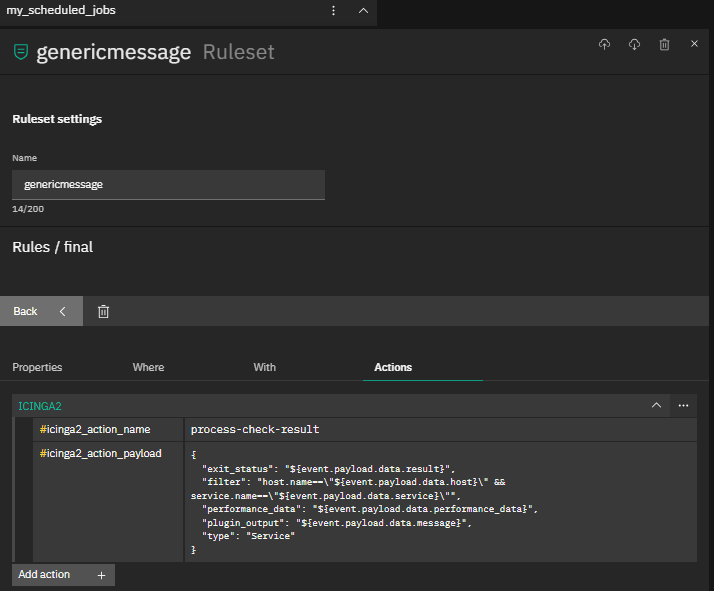
Very simple: set the exit status, the plugin output and the performance data to the host and service that appear on the payload of Tornado message.
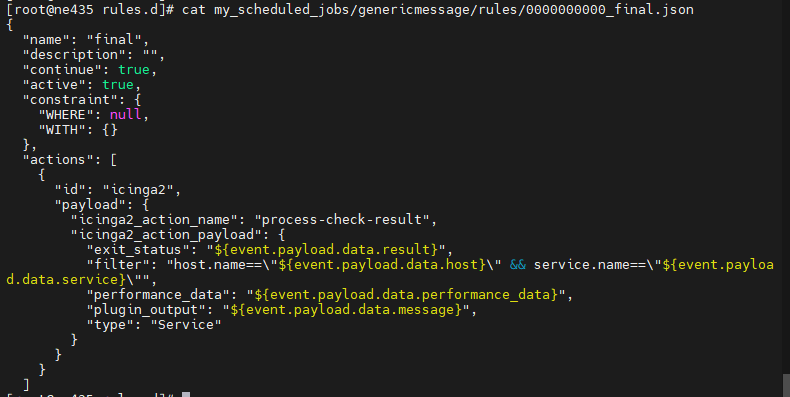
Save and close the Tornado dashboard. Here’s what the full configuration file looks like:
Webhook Creation
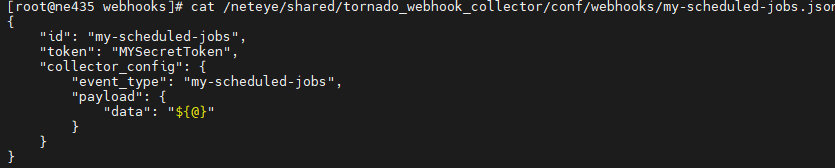
To connect the incoming messages to our Tornado filter we need a Tornado webhook where we specify the ID, the token and the event-type:
After creating the webhook, restart the Tornado service to load the new configuration.
And Now We’re Ready to Go
Now it’s time to send some messages containing the results and metrics of our script. In the previous article we stopped at this point: the host was created, the services were ready and in error because no messages were sent from our scripts.
Now we can try to send some test messages with curl (in this case we send the messages from a NetEye server):
curl -k -v -X POST https://tornado.neteyelocal/tornado/webhook/event/my-scheduled-jobs?token=MYSecretToken \
        -d '{"host": "my-scheduled-jobs.local", "service": "10-extract-info-source1", "result": 0, "message": "OK - Processed values  1287", "performance_data": "'processed_values'=1287;;;0; "}'


curl -k -v -X POST https://tornado.neteyelocal/tornado/webhook/event/my-scheduled-jobs?token=MYSecretToken \
        -d '{"host": "my-scheduled-jobs.local", "service": "20-extract-info-source2", "result": 0, "message": "OK - Processed values  1968", "performance_data": "'processed_values'=1968;;;0; "}'


curl -k -v -X POST https://tornado.neteyelocal/tornado/webhook/event/my-scheduled-jobs?token=MYSecretToken \
        -d '{"host": "my-scheduled-jobs.local", "service": "30-merge-sources", "result": 0, "message": "OK - Processed values  1214", "performance_data": "'processed_values'=1214;;;0; "}'
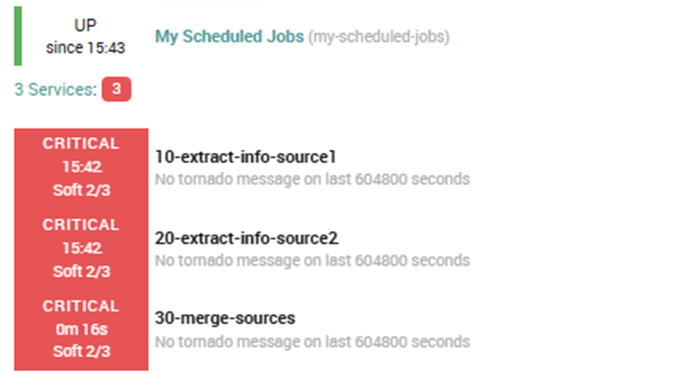
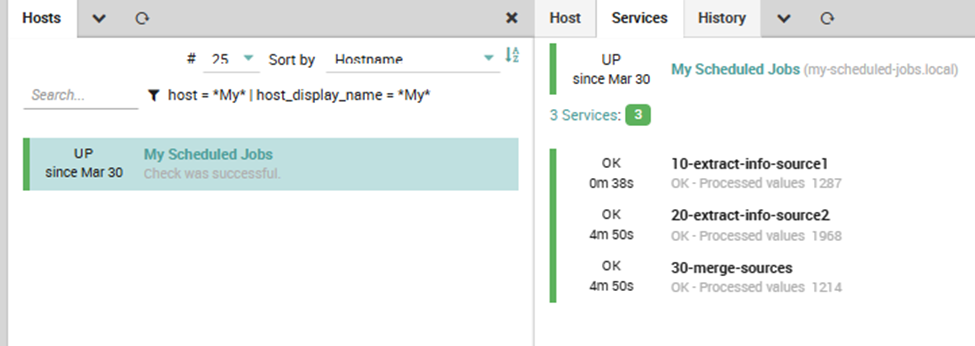
And the results will then appear on our NetEye web interface:
Any Other Ideas?
Now that we have our scripts monitored, we can receive a notification in case of errors or if the script is not running at the required interval. We can also have a little graph panel to display the scripts results and other info processed over time.
Any other ideas ?
These Solutions are Engineered by Humans
Did you find this article interesting? Are you an “under the hood” kind of person? We’re really big on automation and we’re always looking for people in a similar vein to fill roles like this one as well as other roles here at Würth Phoenix.
Paolo Seghetti
Author
Latest posts by Paolo Seghetti
30. 06. 2026
Azure, Cloud, Microsoft, NetEye, NetEye Extension Packs, Unified Monitoring
New NEP Coming Soon: Monitor Your Office 365 Tenant Subscriptions with Confidence
22. 05. 2026
AI, NetEye, Unified Monitoring
An AI Approach for Old SNMP Devices
30. 03. 2026
NetEye, Unified Monitoring
SNMP and Non-connected Interfaces
28. 12. 2025
Automation, Business Service Monitoring, Icinga Web 2, NetEye, Service Management
Automating Notifications in NetEye
30. 09. 2025
NetEye, Unified Monitoring
Business Process Automation on NetEye