18. 10. 2024
Log Management, Log-SIEM, NetEye

When working with Logstash in production, one of the often-overlooked areas is the Dead Letter Queue (DLQ). This queue stores events that Logstash cannot process, usually due to parsing errors, mapping conflicts, or pipeline misconfigurations.
While the DLQ is useful for troubleshooting, leaving it unmonitored can be dangerous: if it grows unnoticed, critical data might never reach Elasticsearch.
To address this issue, starting from NetEye 4.42 we’ve released a native Python check for Icinga that monitors the Logstash DLQ and provides actionable alerts.
Why Monitoring the DLQ Matters
- Data quality: DLQ growth is often a symptom of malformed events or broken pipelines
- Reliability: Large DLQs mean that your ingestion pipeline is silently discarding valuable data
- Proactive alerting: Instead of discovering issues after missing dashboards or alerts, Icinga notifies you as soon as the DLQ crosses defined thresholds
In short, monitoring the DLQ helps turn hidden ingestion problems into visible and actionable alerts.
The Python Check
The plugin is written in Python and uses the Logstash Monitoring API (_node/stats/pipelines) to query DLQ statistics for all pipelines. It evaluates usage against configurable thresholds and returns Icinga-compatible output.
Features
- Thresholds for warning and critical levels (in percent)
- Per-pipeline or multi-pipeline checks
- Performance data for graphing in Icinga
- Visual usage bar in the output
- Graceful handling of missing or unreachable DLQs
This check has already been deployed under the NetEye Local Self Monitoring host:
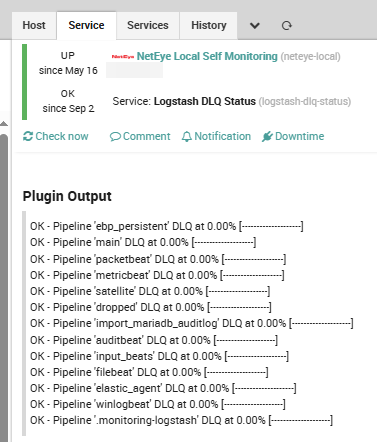
Usage Examples
Check all pipelines with thresholds at 70% (warning) and 90% (critical):
/neteye/shared/monitoring/plugins/check_logstash_dlq.py --host 127.0.0.1 --port 9600 --warning 70 --critical 90Output example:
CRITICAL - Pipeline 'main' DLQ at 92.31% [███████████████████-]
OK - Pipeline 'packetbeat' DLQ at 0.00% [--------------------]
OK - Pipeline 'metricbeat' DLQ at 0.00% [--------------------]
Or check a specific pipeline only:
/neteye/shared/monitoring/plugins/check_logstash_dlq.py --pipeline main --warning 50 --critical 80Real-World Benefits & Conclusion
Since deploying this check, we’ve been able to immediately see:
- Misconfigured grok patterns causing parsing failures
- Mapping conflicts between Logstash and Elasticsearch
- Pipeline regressions after upgrades or config changes
Instead of silently losing data, we now have visibility and can react quickly.
Matteo Cipolletta
Author
Latest posts by Matteo Cipolletta
10. 07. 2026
NetEye Extension Packs
Announcing the New NetEye Extension Pack for Audiocodes Devices in NetEye 4.49
31. 03. 2026
NetEye Extension Packs
Announcing the New NetEye Extension Pack for pfSense Firewall in NetEye 4.47
17. 12. 2025
NetEye
Enabling Self-Service InfluxDB Metrics Migration
12. 05. 2025
Log Management, Log-SIEM
Keeping Elastic Agents Updated in the Dark: A Fully Offline Upgrade Workflow
31. 01. 2025
Log Management, Log-SIEM, NetEye
NFS and Elasticsearch: A Storage Disaster for Data but a Lifesaver for Snapshots