21. 05. 2026
APM, Kubernetes

16. 03. 2026
Francesco Penasa
APM, Development
Bringing OpenTelemetry to Flutter Android for Client-side Observability
Because “it works on my machine” is not an observability strategy.
How It Started
As an observability engineer, my workflow when starting a new project is pretty consistent: find the OpenTelemetry SDK for the language or framework in use, understand its quirks and limitations, and build from there. So when I picked up a Flutter project and went to add observability, I hit an unexpected wall. No official OpenTelemetry SDK for Flutter. There’s one for Android, and one for iOS, but nothing that targets Flutter or Dart officially.
Problem identified. Time for a fast, agile POC to find the solution.
Why Native, and Why It Matters
Full disclosure: I lied slightly. There actually is a Dart implementation, but it’s a community package built on top of the OpenTelemetry APIs, not an official SDK. For a POC that’s meant to validate a real production approach, I wanted something grounded in the official Android implementation, not a community wrapper with uncertain maintenance.
The OpenTelemetry Android SDK ships with capabilities that would take significant effort to replicate in Dart: OkHttp instrumentation and batch processing to reduce network calls and battery consumption, to name two. These are things the official SDK has already solved, so why not steal from that?
Important: For this POC I worked only on manual span tracing, while OkHttp auto-instrumentation and lifecycle hooks are part of the Android agent and ready to be enabled in a future iteration.
The Architecture: A Tale of Two Worlds
Flutter’s Platform Channel mechanism is the key. It’s a message-passing bridge that lets Dart code call into native Kotlin and get results back asynchronously. The architecture is cleanly separated by concern – a mobile developer won’t need to touch the Kotlin code, and an observability engineer won’t need to touch the Flutter implementation.
Flutter/Dart
- Generates a UUID per span
- Knows nothing about OTel internals
- Clean independent Flutter code
- Calls
startSpan,addEvent,endSpan
Kotlin (or Java)/Android
- Owns everything OTel
- Initializes the SDK and exporter
- Manages the active span map
- Handles batching and export
- Full official Android SDK
The bridge between them, which we’ll call OtelMethodChannel, is a simple Kotlin class that listens on a named channel and delegates to the OTel manager singleton. No business logic lives there. It’s a translator, nothing more.
What Gets Instrumented
For this first POC we implemented manual spans, which are the most flexible layer. You wrap any meaningful user-facing operation, such as a checkout flow, a search, a file upload or maybe a navigation transition, within a single span with whatever attributes tell the story: user plan, cart size, retry count, or feature flag state. When something goes wrong, your error isn’t a stack trace floating in a vacuum. It’s a span with meaningful context.
On the Kotlin side, OtelManager initializes the provider and stores spans by ID:
object OtelManager {
    fun init() {
        ...
        // Build the tracer provider with OTLP/HTTP exporter
        val tracerProvider = SdkTracerProvider.builder()
            .addSpanProcessor(BatchSpanProcessor.builder(exporter).build()) // batches spans before sending
            .setResource(resource) // attaches service.name, service.version
            .build()

        tracer = tracerProvider.get(SERVICE_NAME) // single tracer instance, reused for all spans
        ...
    }

    fun startSpan(spanId: String, name: String, attributes: Map<String, String>) {
        val t = tracer ?: run {
            Log.w(TAG, "OTel not initialized – span '$name' dropped") // safe guard if init() wasn't called
            return
        }
        val span = t.spanBuilder(name)
            .apply { attributes.forEach { (k, v) -> setAttribute(k, v) } } // attach all attributes from Dart
            .startSpan()
        activeSpans[spanId] = span // keep a reference so we can end it later from Dart
    }
}
While the Dart side looks exactly as clean as you’d hope:
final span = await OtelBridge.startSpan(
  'checkout.confirm',
  attributes: {
    'cart.size': '3',
    'user.plan': 'premium',
  },
);

try {
  await processCheckout();
  await span.end();
} catch (e) {
  await span.endWithError(e.toString());
  rethrow;
}
Under the hood, startSpan sends the span name and attributes to Kotlin over the platform channel, where the official Android SDK creates the actual span and stores it by ID. end() and endWithError() close it on the native side with the right StatusCode. Your Flutter code never touches an OTel type directly, and it won’t scare you Flutter developers; it just describes what happened, and the native layer handles the rest.
What This Can Unlock
Once telemetry flows into your OpenTelemetry Collector and onwards to your backend, such as Elastic Observability, which has excellent OTLP ingestion support, a few things become immediately visible that were completely invisible before.
Cold start breakdown. How long does your app actually take to show the first interactive screen, split by Android version and device class?
Feature-level latency, end to end. Not “the API is slow” but “the checkout flow takes 800ms longer on mid-range Android 12 devices, and 600ms of that is happening before the HTTP request even leaves the device.”
Truly correlated full-stack traces. The mobile client and the backend share a trace ID. There is no more “it’s a client issue” vs “it’s the API.” The trace shows the full chain. Everyone looks at the same data.
Silent failures. Not the crashes – those get reported. The quiet ones that return wrong data, swallow up exceptions, or time out without telling anyone. Instrument your data layer and you’ll find them. They’ve been there the whole time.
And Now the Results!
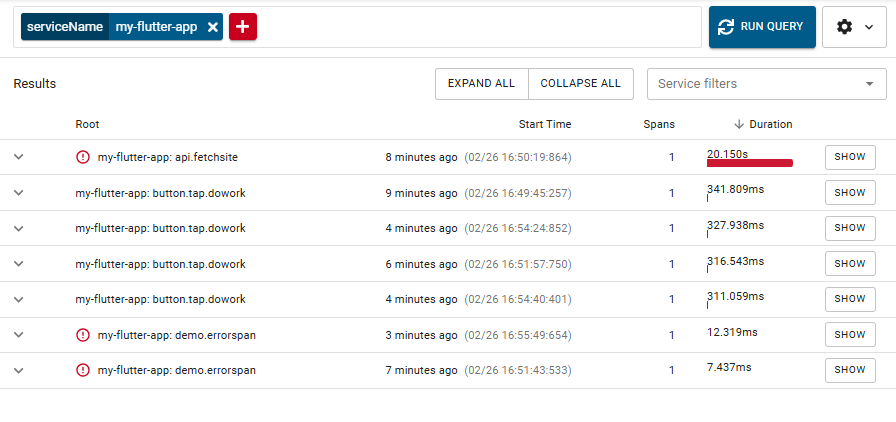
Below is a screenshot of the traces gathered in the collector to which the Flutter application has been connected, as you can see, it works!
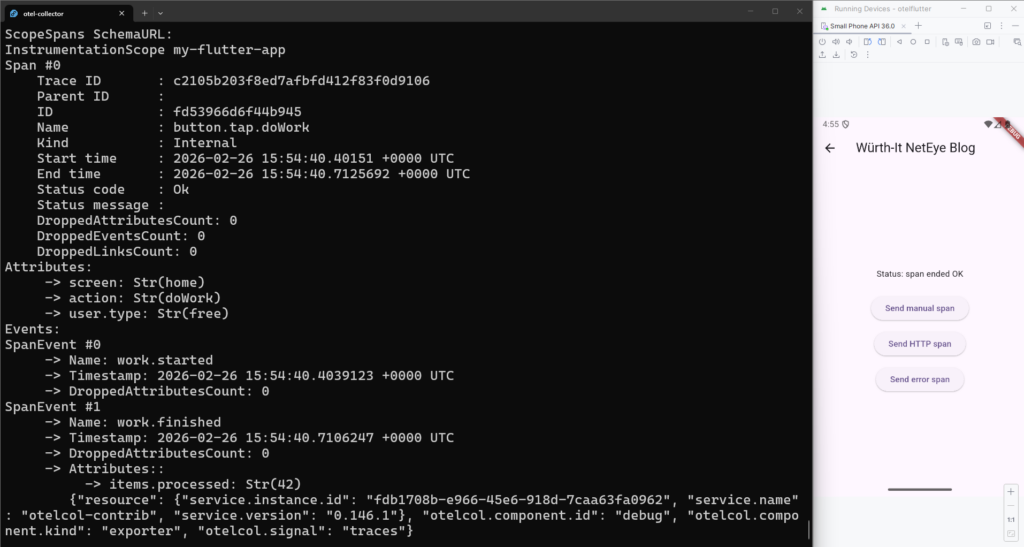
The traces can of course be visualized in any system that can receive data from an OTel collector.
And now we have some observability glasses to look into our small Flutter app, on Android for now… but Flutter also supports Windows, Linux, Mac, Web and iOS, so there’s more work to be done.
These Solutions are Engineered by Humans
Are you passionate about performance metrics or other modern IT challenges? Do you have the experience to drive solutions like the one above? Our customers often present us with problems that need customized solutions. In fact, we’re currently hiring for roles just like this as well as other roles here at Würth IT Italy.
Francesco Penasa
Hi! I'm Francesco, Observability Engineer at Wuerth IT Italy focused on making sure complex systems stay transparent, predictable and do exactly what they're supposed to. That drive traces back to my Master's in Computer Science, where formal methods and the theoretical foundations of the field taught me to care deeply about correctness and understanding the root cause of things. That same curiosity naturally pulled me into software development, and more recently into AI and machine learning (including LLMs of course), which are, for better or worse, the opposite of deterministic. It's a strange place to end up for someone who likes things to behave. My biggest daily challenge? Myself. I firmly believe that comfort zones are overrated, so I constantly push myself to take on new challenges and keep laziness at bay. Spoiler: it's an ongoing battle.
Author
Latest posts by Francesco Penasa
21. 05. 2026
APM, Kubernetes
Observability on OpenShift: A Case Study with Red Hat OpenTelemetry and eBPF