
Während Alyvix, unsere Engine für’s End User Monitoring, zur Überwachung für alle Arten von Applikationen genutzt werden kann (Web-Browser inklusive), nutzen wir für die Überwachung von Web Applikationen das Tool Sahi, und für größere Infrastrukturen SahiPro. Diese Tools sind insofern performanter als Alyvix, da sie auch innerhalb des DOM eines Web-Browsers arbeiten können. Somit sind sie nicht vom Vorhandensein von Bildschirmbildern zur Kontrolle der Applikationen abhängig.
Das bedeutet, dass ein einzelner Server viele verschiedene Web-Navigationen gleichzeitig ausführen kann, während Alyvix jeweils nur eine Bewegung ausführt. Kürzlich habe ich SahiPro bei einem unserer Enterprise-Kunden implementiert. Dort sind wir nun in der Lage, durch den Einsatz von 3 SahiPro Servern, in 5-Minuten Abständen, 300 Navigationen auszuführen. Zwei der Prozesse laufen parallel auf einem NetEye Server (für den Leistungsausgleich). Eine dritte SahiPro Installation auf einem Windows Server wird benötigt, da einige Akionen über Internet Explorer ausgeführt werden müssen, welcher wiederum nur auf Windows Plattformen zur Verfügung steht.
Wenn Sie den Check auf Ihrem NetEye/Nagios Server ausführen, sehen Sie ob Ihre Web Applikationen über den Exitcode des Plugins funktionieren. Wie gut die Web Applikation über einen bestimmten Zeitraum funktioniert hat, können Sie den ermittelten Performancedaten und Graphen entnehmen:
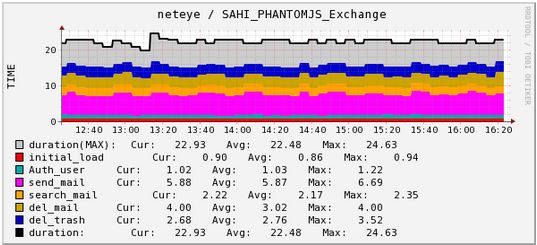
SahiPro Navigation Performance Graph
Außerdem sehen Sie auch den detaillierten HTML-Log von SahiPro, inklusive dem „Last Navigation Image“.
Nagios Service Output
Und hier sehen Sie ein Beispiel wenn Sie auf die “Log” URL im Plugin Output klicken:
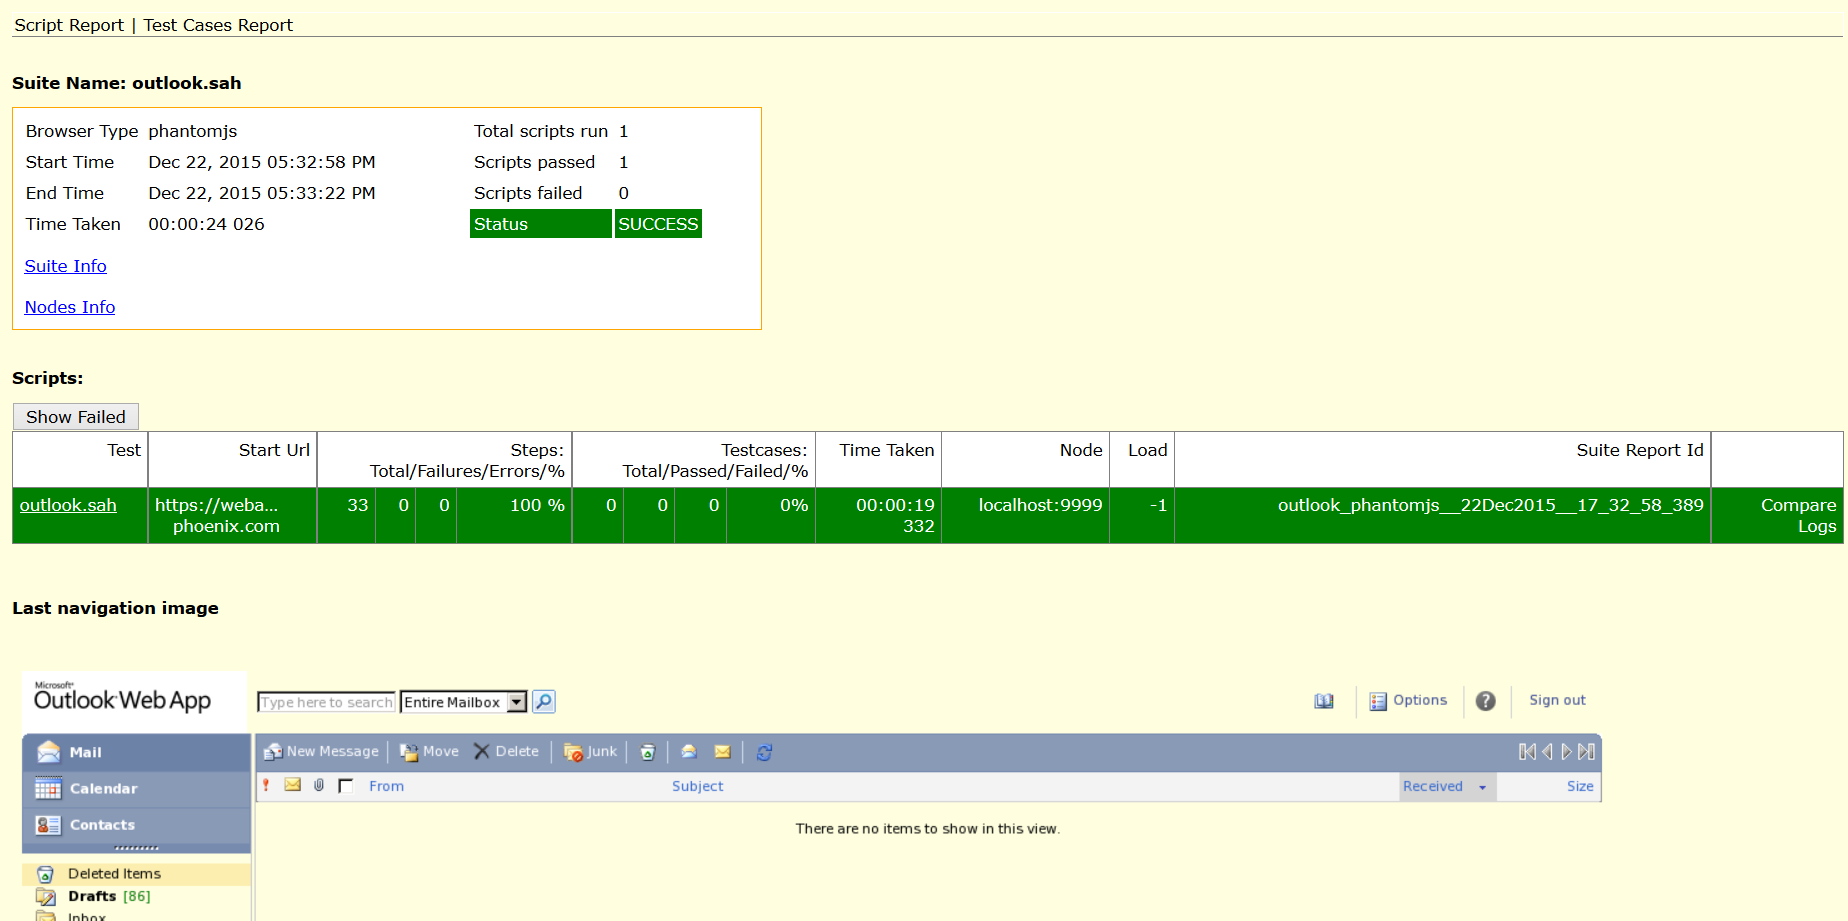
SahiPro HTML Report mit “Last Navigation Image”
Benutzen Sie dieses Nagios Plugin um Sahi-Navigationen auszuführen. Sie benötigen lediglich ein Sahi(Pro) Server Setup um das Plugin zu nutzen.
Viel Spaß beim Überwachen Ihrer Web Applikationen!


Juergen Vigna
NetEye Solution Architect at Würth IT Italy
I have over 20 years of experience in the IT branch. After first experiences in the field of software development for public transport companies, I finally decided to join the young and growing team of Würth Phoenix (now Würth IT Italy). Initially, I was responsible for the internal Linux/Unix infrastructure and the management of CVS software. Afterwards, my main challenge was to establish the meanwhile well-known IT System Management Solution WÜRTHPHOENIX NetEye. As a Product Manager I started building NetEye from scratch, analyzing existing open source models, extending and finally joining them into one single powerful solution. After that, my job turned into a passion: Constant developments, customer installations and support became a matter of personal. Today I use my knowledge as a NetEye Senior Consultant as well as NetEye Solution Architect at Würth Phoenix.
Author
Latest posts by Juergen Vigna
22. 05. 2025
NetEye, Unified Monitoring
Automatic Integration of NagVis Map into Icinga Web 2/NetEye Monitoring