


02. 04. 2026
NetEye, Unified Monitoring

24. 07. 2018
Juergen Vigna
NetEye, Unified Monitoring
Total Control Over Your Citrix User Connections
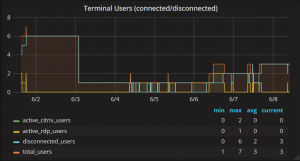
Do you have Citrix or Windows RDP servers, and your users keep calling you because of problems? The first problem is to see which server the user was connected to. I solved this problem by monitoring the user connections on Windows Terminal Servers (including Citrix Servers), so that you know how many users are connected or disconnected, and how long they stay on any of your servers.
The plugin check_nrpe_windows_users gets all connected/disconnected Windows users and splits them by type, including Citrix/RDB (connected). The plugin connects over the NRPE protocol to the Windows server, where in NSClient++ you have to insert the following external command to get the Windows users:
[/settings/external scripts/scripts]
get_users=query user
Query User is a standard Windows command and is always available.
The above plugin should be scheduled by your monitoring daemon in this way:
Usage: check_nrpe_windows_users -H|--host <hostname/ip> [-L|--ldap ] [--verbose] [--warning ] [--critical ]

Usage: check_nrpe_windows_users --help

Usage: check_nrpe_windows_users --version
This gets the Windows user via an NRPE executed query user command and shows the results. The parameters are:
-H|–host … host/IP on which to see users
-L|–ldap … host/IP of an LDAP server to be able to resolve names from logins
–verbose … list all users found and their state
–warning … warning threshold that will be triggered when value >= warning
–critical … critical threshold that will be triggered when found value >= critical
As seen above, you can also pass the LDAP server host/credentials so that the login names may be resolved into real names. You should do that only if you use the –verbose switch. Otherwise this is not needed.
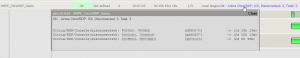
The output of your verbose monitoring check will then look something like this:

Juergen Vigna
NetEye Solution Architect at Würth IT Italy
I have over 20 years of experience in the IT branch. After first experiences in the field of software development for public transport companies, I finally decided to join the young and growing team of Würth Phoenix (now Würth IT Italy). Initially, I was responsible for the internal Linux/Unix infrastructure and the management of CVS software. Afterwards, my main challenge was to establish the meanwhile well-known IT System Management Solution WÜRTHPHOENIX NetEye. As a Product Manager I started building NetEye from scratch, analyzing existing open source models, extending and finally joining them into one single powerful solution. After that, my job turned into a passion: Constant developments, customer installations and support became a matter of personal. Today I use my knowledge as a NetEye Senior Consultant as well as NetEye Solution Architect at Würth Phoenix.
Author
Latest posts by Juergen Vigna
22. 05. 2025
NetEye, Unified Monitoring
Automatic Integration of NagVis Map into Icinga Web 2/NetEye Monitoring