


31. 03. 2026
Log-SIEM, NetEye, Unified Monitoring

27. 06. 2019
Giuseppe Di Garbo
Business Service Monitoring, NetEye
Network Performance Monitoring Automation with NetEye 4

Automating the monitoring process in Enterprise environments is a challenge that led Icinga to create features such as their REST API and the Icinga Director module.
In both new NetEye4 projects and those being migrated from NetEye3 to NetEye4, this challenge is one of the aspects that I highlight the most and is certainly one of the features most appreciated by our customers.
100% automation of the monitoring process is very difficult, if not impossible, but with NetEye4 we have taken a huge step forward.
In this post I will not focus on Director’s functionality (already widely documented online), but on some aspects related to the requirements for this module to be configured to best practice, and some proven implementation scenarios that have enabled significant improvement towards process automation in network performance monitoring.
Director is an Icinga module perfectly integrated into NetEye4 which via API allows for the creation, modification and deletion of monitoring objects.
Director allows you to automate all these tasks with three steps:
- Import source
- Sync rule
- Jobs scheduling
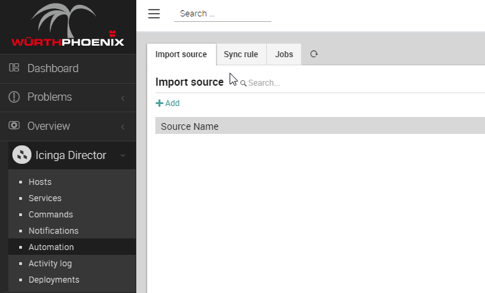
Import source
Director allows you to configure different Import Sources. The purpose is to create a data source that can then be used to create monitoring objects.
And it is precisely at this stage that the challenge to automation often clashes with reality. Importing data into NetEye 4 requires the ability to depend on one or more reliable, up-to-date and well-structured data sources from which monitoring objects can be imported, but in reality this is not always the case.
Often the monitoring process involves many heterogeneous objects ranging from operating systems, applications to network devices, storage, UPS, etc., and finding an up-to-date and reliable data source is indeed a challenge. However, this aspect has a positive side: tackling this need within the project and sharing the steps to reach it.
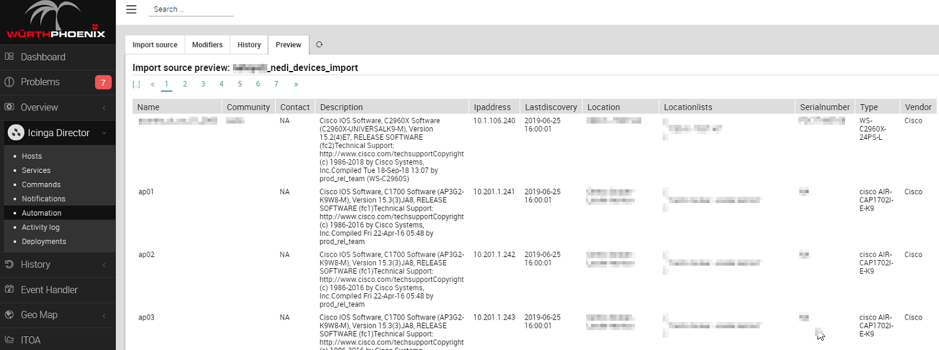
The scenarios I faced in recent NetEye 3 to NetEye 4 migration projects immediately focused on this need and, for the automation of the network performance monitoring process, the choice always fell to NeDi.
Thanks to NeDi it is in fact possible to obtain a true CMDB of any object with an IP address and that supports the SNMP protocol. And with a simple connection to its database we can obtain a complete import source of the network devices to be used for monitoring.
Here is an example of previewing the data of an Import Source connected to the NeDi database::
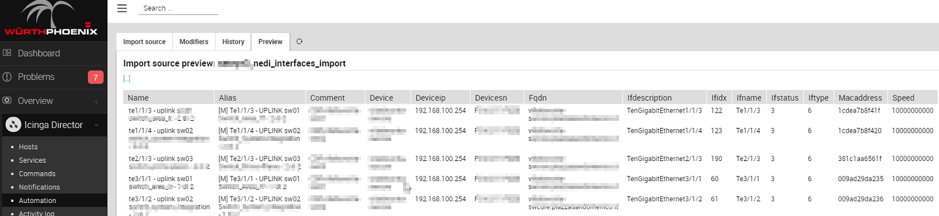
It is also possible to automatically and selectively monitor the network interfaces of the devices detected by NeDi using another dedicated Import Source (for instance, to measure their availability or throughput).
This particular aspect can be tackled in two steps:
- Configure an agreed-upon pattern in the Description field of the interfaces to be monitored
- Import all the interfaces present on NeDi whose description field contains the agreed-upon pattern
In the following example, the pattern was added to the beginning of the interface description and is visible in the “Alias” column. The pattern is: [M]
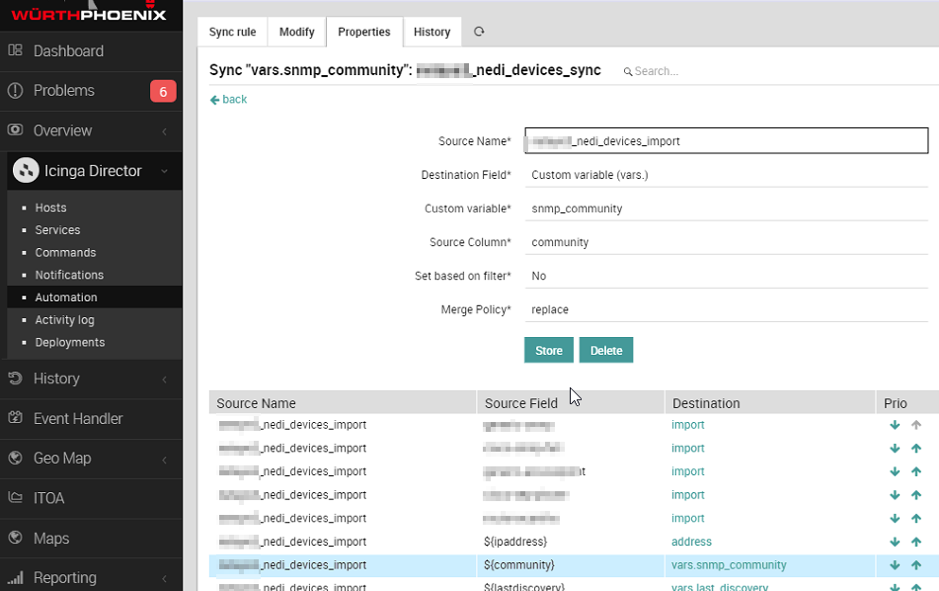
Sync rules and Jobs scheduling
After configuring all the necessary import sources, you can use the power of Director via the Sync rules and Jobs scheduling.
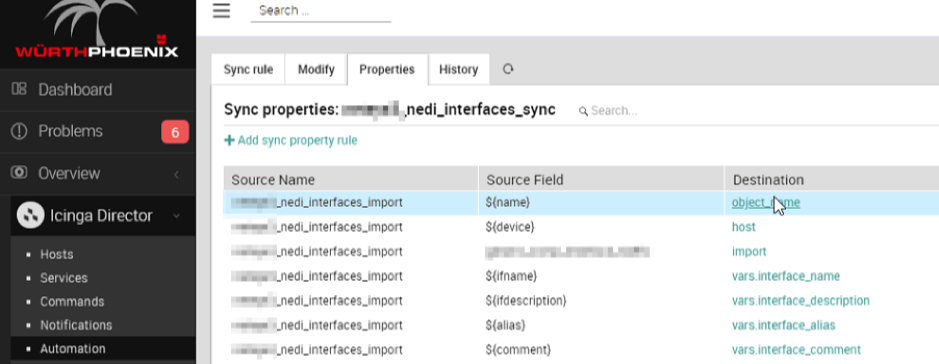
The Sync rules allow you to use the imported data to generate configurations for NetEye 4. In practice, the data obtained from the Import Source is mapped into objects and properties in Icinga.
Below are two examples of Sync Rule data from two Import Sources connected to the NeDi database (one for devices and the other for interfaces)
Finally, to activate the automation, it is possible to schedule Import Source and Sync rule through dedicated Jobs.
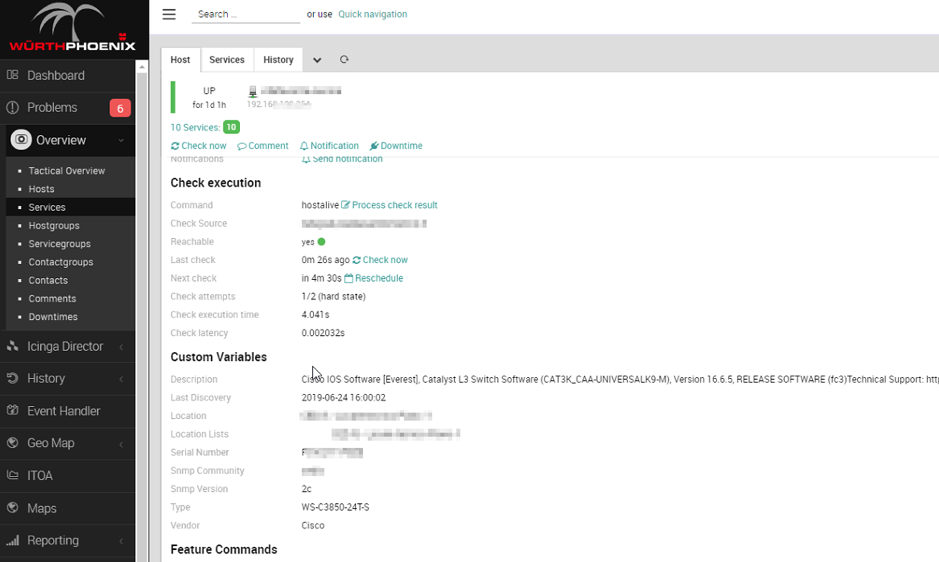
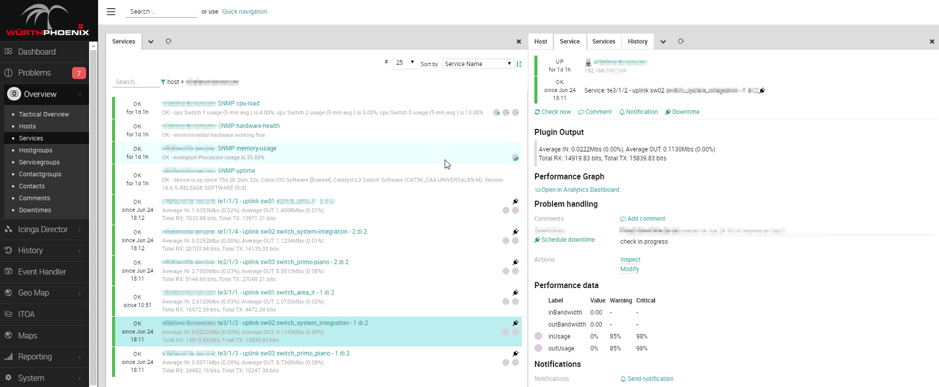
In the following example you can see some of the results we achieved:
- For each imported network device, we can enrich the monitoring data by making information available from NeDi in the Custom Variables section
- The network switch shown in the example is monitored through a dynamically associated host template that includes hardware-health, cpu-load, memory-usage and uptime checks
- The monitored interfaces of the switch are those filtered in the Sync rule and are monitored using a service template that dynamically uses the information from NeDi (such as interface name, community, etc.)

Giuseppe Di Garbo
Consultant at Würth IT Italy
Hi everybody. I’m Giuseppe and I was born in Milan in 1979. Since the early years of university, I was attracted by the Open Source world and operating system GNU\Linux. After graduation I had the opportunity to participate in a project of a startup for the realization of an Internet Service Provider. Before joining Würth Phoenix (now Würth IT Italy) as SI consultant, I gained great experience as an IT consultant on projects related to business continuity and implementation of open source software compliant to ITIL processes of incident, change and service catalog management. My free time is completely dedicated to my wife and, as soon as possible, run away from Milan and his caotic time and trekking discover our beautiful mountain near Lecco for relax and lookup the (clean) sky.
Author
Latest posts by Giuseppe Di Garbo
19. 12. 2025
Atlassian, Service Management
Jira Service Management Customer Detail Fields: A Practical Use Case
29. 09. 2025
Atlassian, Service Management
Streamlining Service Request Management with ITIL4 and Jira Service Management
30. 06. 2025
Atlassian, Service Management
Creating Jira Service Management Requests from a Public Website? Here’s the Secure, No-API Way
28. 03. 2025
Atlassian, Service Management
Effortless On-Call Management with Jira Service Management