08. 09. 2025
Service Management

Do you have a NetEye server, and want to monitor your VMware ESXi Infrastructure? Nothing easier than that using the InfluxDB and Grafana Modules of NetEye, along with a Telegraf agent to deliver the data into Influx.
Starting with version 1.6.x of Telegraf, there’s a plugin for querying for data from a vSphere server, but it’s best to use the last stable release of Telegraf > 1.8.0. The VMware vSphere plugin uses the vSphere API to gather metrics from multiple vCenter servers, including metrics for clusters, hosts, VMs and datastores. It supports vSphere versions from 5.5 to 6.7.
# Read metrics from VMware vCenter
[[inputs.vsphere]]
 ## List of vCenter URLs to be monitored. These three lines must be uncommented
 ## and edited for the plugin to work.
 vcenters = [ "https://vmcenter.example.com/sdk" ]
 username = "myuser"
 password = "mypassword"
 ## VMs
 ## Typical VM metrics (if omitted or empty, all metrics are collected)
   vm_metric_include = [
     "cpu.demand.average",
     "cpu.idle.summation",
     "cpu.latency.average",
     "cpu.readiness.average",
     "cpu.ready.summation",
     "cpu.run.summation",
     "cpu.usagemhz.average",
     "cpu.used.summation",
     "cpu.wait.summation",
     "mem.active.average",
     "mem.granted.average",
     "mem.latency.average",
     "mem.swapin.average",
     "mem.swapinRate.average",
     "mem.swapout.average",
     "mem.swapoutRate.average",
     "mem.usage.average",
     "mem.vmmemctl.average",
     "net.bytesRx.average",
     "net.bytesTx.average",
     "net.droppedRx.summation",
     "net.droppedTx.summation",
     "net.usage.average",
     "power.power.average",
     "virtualDisk.numberReadAveraged.average",
     "virtualDisk.numberWriteAveraged.average",
     "virtualDisk.read.average",
     "virtualDisk.readOIO.latest",
     "virtualDisk.throughput.usage.average",
     "virtualDisk.totalReadLatency.average",
     "virtualDisk.totalWriteLatency.average",
     "virtualDisk.write.average",
     "virtualDisk.writeOIO.latest",
     "sys.uptime.latest",
   ]
 # vm_metric_exclude = [ "*" ] ## Nothing is excluded by default
 vm_instances = false ## true by default
 ## Hosts
 ## Typical host metrics (if omitted or empty, all metrics are collected)
 host_metric_include = [
     "cpu.coreUtilization.average",
     "cpu.costop.summation",
     "cpu.demand.average",
     "cpu.idle.summation",
     "cpu.latency.average",
     "cpu.readiness.average",
     "cpu.ready.summation",
     "cpu.swapwait.summation",
     "cpu.usage.average",
     "cpu.usagemhz.average",
     "cpu.used.summation",
     "cpu.utilization.average",
     "cpu.wait.summation",
     "disk.deviceReadLatency.average",
     "disk.deviceWriteLatency.average",
     "disk.kernelReadLatency.average",
     "disk.kernelWriteLatency.average",
     "disk.numberReadAveraged.average",
     "disk.numberWriteAveraged.average",
     "disk.read.average",
     "disk.totalReadLatency.average",
     "disk.totalWriteLatency.average",
     "disk.write.average",
     "mem.active.average",
     "mem.latency.average",
     "mem.state.latest",
     "mem.swapin.average",
     "mem.swapinRate.average",
     "mem.swapout.average",
     "mem.swapoutRate.average",
     "mem.totalCapacity.average",
     "mem.usage.average",
     "mem.vmmemctl.average",
     "net.bytesRx.average",
     "net.bytesTx.average",
     "net.droppedRx.summation",
     "net.droppedTx.summation",
     "net.errorsRx.summation",
     "net.errorsTx.summation",
     "net.usage.average",
     "power.power.average",
     "storageAdapter.numberReadAveraged.average",
     "storageAdapter.numberWriteAveraged.average",
     "storageAdapter.read.average",
     "storageAdapter.write.average",
     "sys.uptime.latest",
   ]
 # host_metric_exclude = [] ## Nothing excluded by default
 # host_instances = true ## true by default
 ## Clusters
 cluster_metric_include = [] ## if omitted or empty, all metrics are collected
 cluster_metric_exclude = [ "*" ] ## Nothing excluded by default
 # cluster_instances = true ## true by default
 ## Datastores
 datastore_metric_include = [] ## if omitted or empty, all metrics are collected
 # datastore_metric_exclude = [ "*" ] ## Nothing excluded by default
 # datastore_instances = false ## false by default for Datastores only
 ## Datacenters
 datacenter_metric_include = [] ## if omitted or empty, all metrics are collected
 # datacenter_metric_exclude = [ "*" ] ## Datacenters are not collected by default.
 # datacenter_instances = false ## false by default for Datastores only
 ## Plugin Settings
 ## separator character to use for measurement and field names (default: "")   # separator = ""
 ## number of objects to retreive per query for realtime resources (vms and hosts)
 ## set to 64 for vCenter 5.5 and 6.0 (default: 256)
 # max_query_objects = 256
 ## number of metrics to retreive per query for non-realtime resources (clusters and datastores)
 ## set to 64 for vCenter 5.5 and 6.0 (default: 256)
 # max_query_metrics = 256
 ## number of go routines to use for collection and discovery of objects and metrics
 collect_concurrency = 10
 discover_concurrency = 2
 ## whether or not to force discovery of new objects on initial gather call before collecting metrics
 ## when true for large environments this may cause errors for time elapsed while collecting metrics
 ## when false (default) the first collection cycle may result in no or limited metrics while objects are discovered
 # force_discover_on_init = false
 ## the interval before (re)discovering objects subject to metrics collection (default: 300s)
 # object_discovery_interval = "900s"
 ## timeout applies to any of the api request made to vcenter
 timeout = "1800s"
 ## Optional SSL Config
 # ssl_ca = "/path/to/cafile"
 # ssl_cert = "/path/to/certfile"
 # ssl_key = "/path/to/keyfile"
 ## Use SSL but skip chain & host verification
 insecure_skip_verify = true
 force_discover_on_init = true
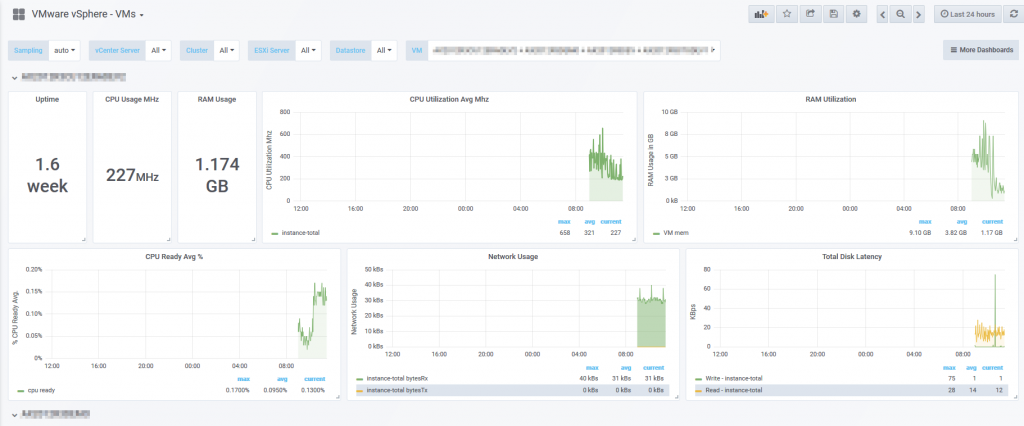
Using this Telegraf configuration, NetEye should begin collecting the VMware metrics from your vCenter server. Now you should import some Dashboards into your NetEye Grafana Module. You can download a .zip file with the following Dashboards from here.
1. Overview Dashboard
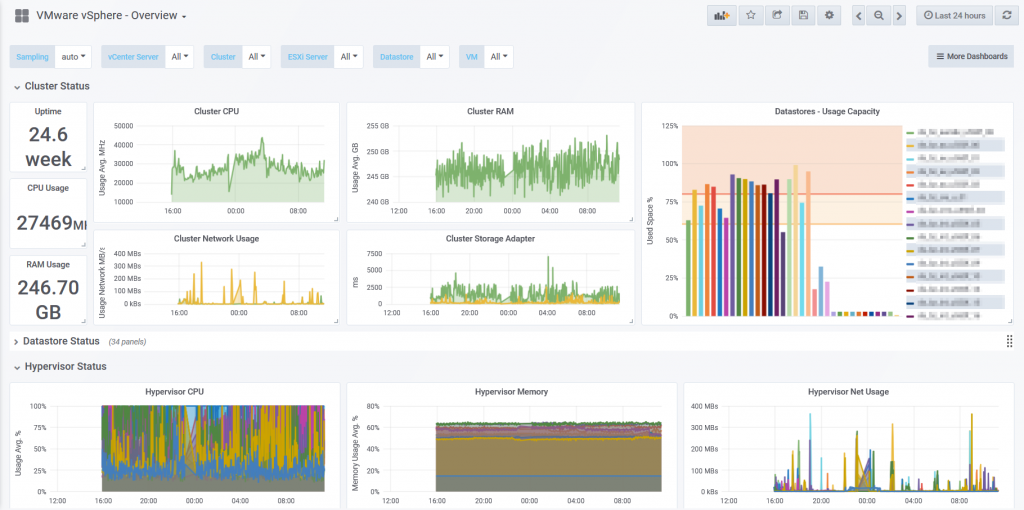
2. Host Dashboard
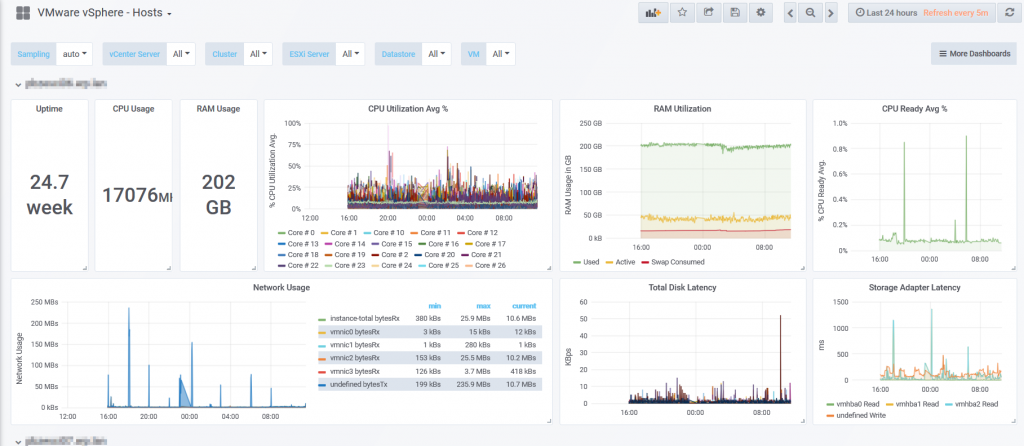
3. Datastore Dashboard
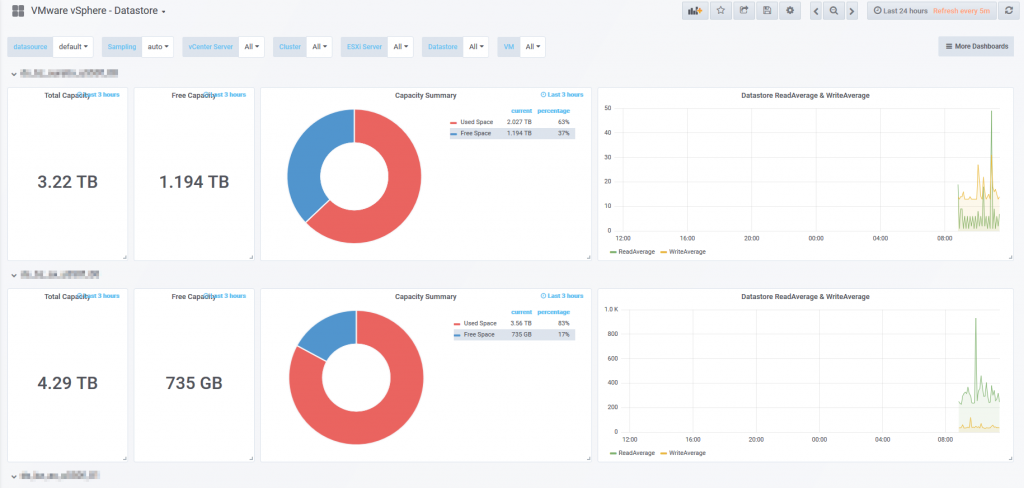
4. VMs Dashboard
It can take some time before the Telegraf plugin collects enough data, as it doesn’t ask for all data immediately, so just be patient…

Juergen Vigna
NetEye Solution Architect at Würth IT Italy
I have over 20 years of experience in the IT branch. After first experiences in the field of software development for public transport companies, I finally decided to join the young and growing team of Würth Phoenix (now Würth IT Italy). Initially, I was responsible for the internal Linux/Unix infrastructure and the management of CVS software. Afterwards, my main challenge was to establish the meanwhile well-known IT System Management Solution WÜRTHPHOENIX NetEye. As a Product Manager I started building NetEye from scratch, analyzing existing open source models, extending and finally joining them into one single powerful solution. After that, my job turned into a passion: Constant developments, customer installations and support became a matter of personal. Today I use my knowledge as a NetEye Senior Consultant as well as NetEye Solution Architect at Würth Phoenix.
Author
Latest posts by Juergen Vigna
22. 05. 2025
NetEye, Unified Monitoring
Automatic Integration of NagVis Map into Icinga Web 2/NetEye Monitoring