


02. 04. 2026
NetEye, Unified Monitoring

07. 05. 2021
Franco Federico
Log Management, Log-SIEM, NetEye
Collecting Network and DNS Logs on Your Infrastructure
Several customers have asked us how they can collect DNS logs. In our solution, we proposed a Packetbeat Agent that allows you to collect data and send them to our centralized NetEye SIEM directly, or via a NetEye satellite.
The Domain Name System (DNS) provides a hierarchy of names for computers and services on the Internet or other networks. Its most noteworthy function is the translation of domain names such as example.com into IP addresses. DNS is required for the Internet to function, operates on a global scale, and is massively distributed.
DNS servers normally accept messages on UDP port 53. The DNS protocol has two message types, queries and replies; both use the same format. These messages are used to transfer resource records (RRs), which contain a name, a time-to-live (TTL), a class (normally IN), a type, and a value. For example, an A-type resource record specifies the IPv4 address associated with a domain. The domain name space is divided into DNS zones, and a server is considered authoritative if it has authority over a particular zone.
It’s very important to have this data within our SIEM in order to correlate data on other sources and to analyze possible threats.
Packetbeat is a lightweight network packet analyzer that sends data from your hosts and containers to our NetEye SIEM. We suggest downloading this package and installing it on a probe. This software requires the libpcap library collector to be installed in order to send the information to our NetEye SIEM.
The macro-steps to activate data collection are:
- Download and install a packet sniffing library, such as Npcap, that implements the libpcap interfaces on the probe (for example on Windows server it’s available at https://nmap.org/npcap/)
- Download and install Packetbeat on the probe (we used Packetbeat 7.10.1)
- Configure packetbeat.yml on the probe to send data to NetEye SIEM (we configure output to logstash with the certificates)
- Configure NetEye SIEM to collect this data (create a template and ILM to adminster this data)
- Start the service on the probe (we recommend checking it before starting it)
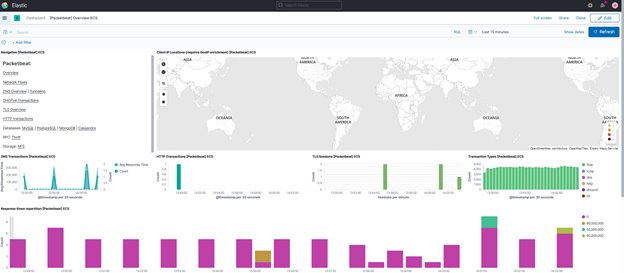
- View the data collected on NetEye SIEM (we have multiple pre-configured dashboards ready for this)
And voilà…
Packetbeat Overview:
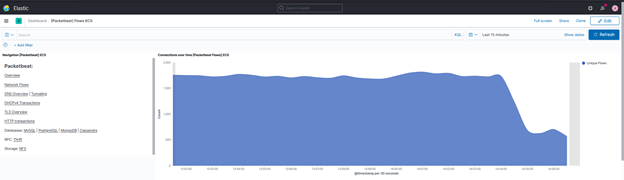
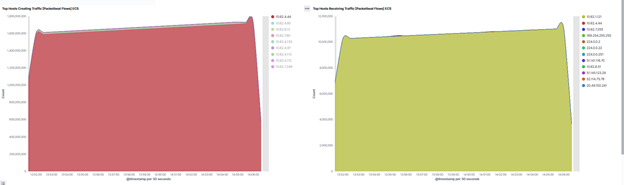
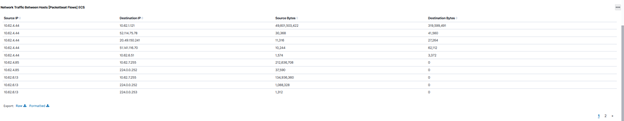
Network flow:
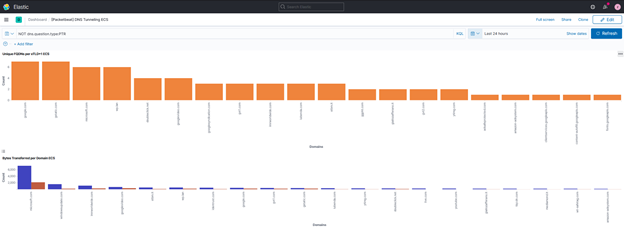
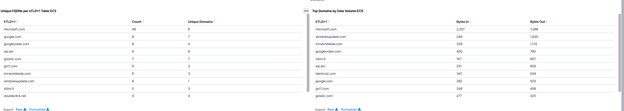
DNS Tunneling:
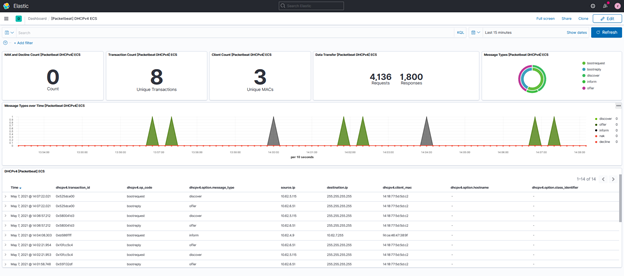
DHCP:
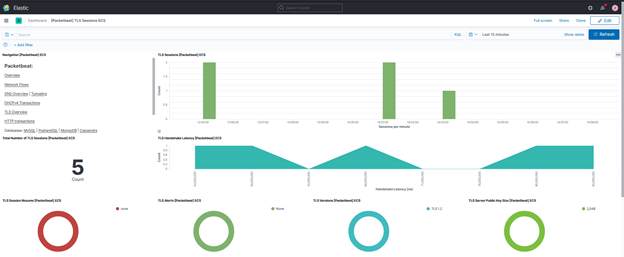
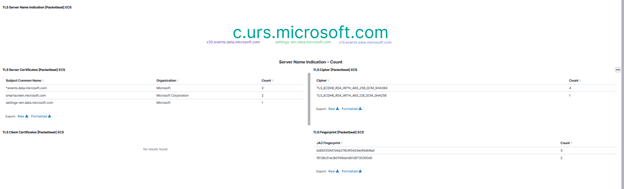
TLS:
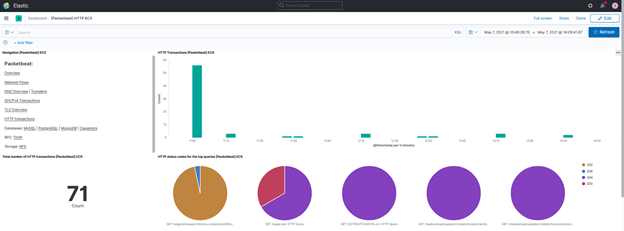
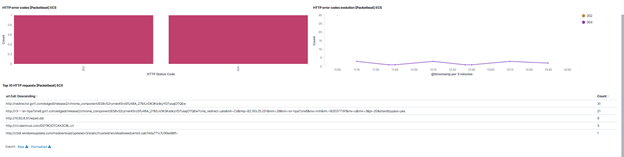
HTTP:
Packetbeat is also a library, supporting many application layer protocols, from database to key-value stores to HTTP and low-level protocols. For the database for example we have:
- MySQL
- PostgreSQL
- MongoDB
- Cassandra
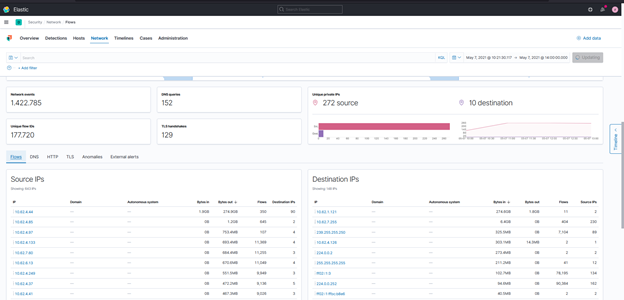
In addition to all these beautiful dashboards we also have the data within our SIEM, so we can also see this data within APP Security in the Network section:
Flow:
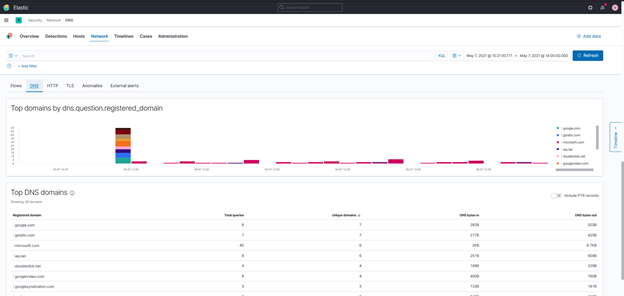
DNS:
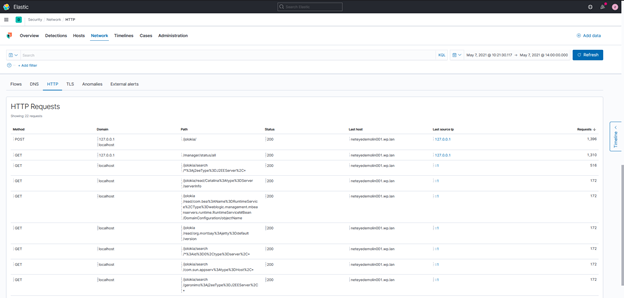
HTTP:
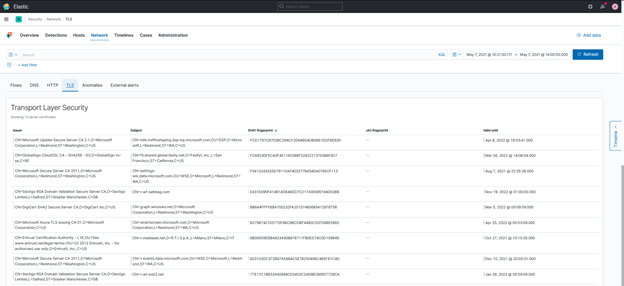
TLS:
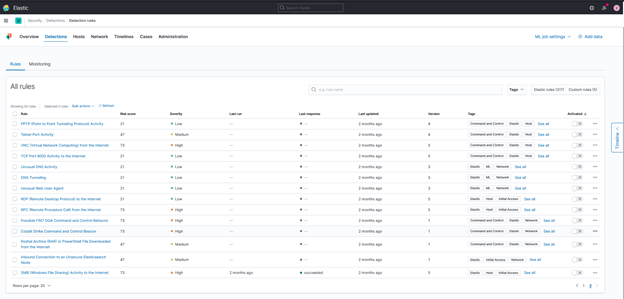
Now that we’ve gathered all this data related to the network traffic due to sniffing on our infrastructure, we can activate the detection rules on the network.
We have about 40 detection rules that can help us to detect threats:
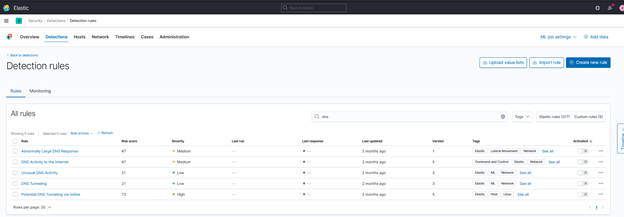
For the DNS we have:
If you are interested in this topic, don’t hesitate to contact us. We can even show you this feature in our live NetEye SIEM demo.
Franco Federico
Hi, I’m Franco and I was born in Monza. For 20 years I worked for IBM in various roles. I started as a customer service representative (help desk operator), then I was promoted to Windows expert. In 2004 I changed again and was promoted to consultant, business analyst, then Java developer, and finally technical support and system integrator for Enterprise Content Management (FileNet). Several years ago I became fascinated by the Open Source world, the GNU\Linux operating system, and security in general. So for 4 years during my free time I studied security systems and computer networks in order to extend my knowledge. I came across several open source technologies including the Elastic stack (formerly ELK), and started to explore them and other similar ones like Grafana, Greylog, Snort, Grok, etc. I like to script in Python, too. Then I started to work in Würth Phoenix like consultant. Two years ago I moved with my family in Berlin to work for a startup in fintech(Nuri), but the startup went bankrupt due to insolvency. No problem, Berlin offered many other opportunities and I started working for Helios IT Service as an infrastructure monitoring expert with Icinga and Elastic, but after another year I preferred to return to Italy for various reasons that we can go into in person 🙂 In my free time I continue to dedicate myself to my family(especially my daughter) and I like walking, reading, dancing and making pizza for friends and relatives.
Author
Latest posts by Franco Federico
10. 03. 2026
Unified Monitoring
Elastic AutoOps in NetEye: Simplifying Elasticsearch Operations with Real-Time Intelligence
09. 09. 2025
NetEye
Backing up a MariaDB Galera Cluster
12. 06. 2025
NetEye, Unified Monitoring
From Monitoring to SOC
17. 02. 2025
Unified Monitoring
Monitoring Printer Logs