


01. 04. 2026
Downloads / Release Notes, NetEye, Unified Monitoring

02. 08. 2021
Thomas Forrer
Downloads / Release Notes, NetEye, Unified Monitoring
NetEye 4.19 Release Notes
Welcome to version 4.19 of our NetEye v4 Unified Monitoring Solution.
In this release, NetEye moves away from the Dolomites to show another iconic landmark of South Tyrol, the Lago di Resia/Reschensee with its submerged bell tower. A symbol of perseverance, the bell tower of ancient Curon Venosta/Graun im Vinschgau town rises above the lake as a protective watchman of the quiet and beautiful Val Venosta/Vinschgau.

General
Improvements
User Guide
To improve navigation of the user guide we made the Monitoring - Detection section more structured by adding a 3rd level menu and splitting it in multiple pages.
The result is that the pages are shorter and more focused on individual topics, so the user can reach the desired information faster.
InfluxDB Authentication
Starting with NetEye 4.19, InfluxDB built-in authentication based on user credentials and TLS encryption is enabled by default. This is another step on our way to make NetEye even more secure and reliable.
For management purposes, an InfluxDB administrator user is now created by default. The Icinga2’s InfluxDB Writer feature and the Grafana influxdb-icinga2 datasource configuration are also updated to support the new authentication mechanism, with dedicated users to perform write-only and read-only operations on InfluxDB.
TLS ensures that credentials are transmitted on an encrypted channel, thus further increasing security also inside the internal network.
Existing agent configurations, like telegraf agents, that read or write data directly to InfluxDB must be manually updated to use the new authentication mechanism and TLS encryption or migrated to NATS output.
For additional details about InfluxDB user configuration please refer to the User Guide.
Update and Upgrade Procedure – Automation
To support the user during the NetEye update procedure, we introduced the neteye update command, which automatically controls the health and cluster statuses of NetEye, and installs the latest bug fixes and patches. Detailed information is provided in the official NetEye User Guide.
In order to reduce the steps that customers must manually run during the upgrade procedure, the neteye update and neteye upgrade commands now take care also of putting in stand-by all nodes of the cluster, except for the one where they are issued.
Monitoring – Detection
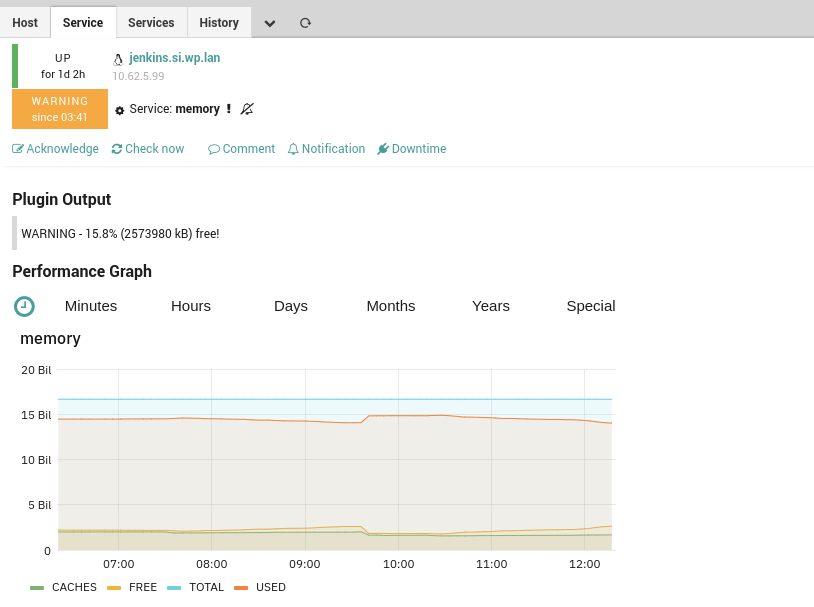
Performance Graph
In NetEye 4.19 the ITOA Analytics Dashboard will be completely substituted by the fresh new icingaweb2-module-grafana module. This module allows to displays graphs with performance metrics directly on the monitored object page.
Linking a custom dashboard to a monitored object will still be possible, in this case, the dashboard will open in a new column as usual.
Tornado – Async Computation
In all systems, no matter how powerful they are, computational resources are limited and valuable. Therefore, it is important that all software that runs on them limits as much as possible resources consumption.
To accomplish this goal, Tornado has now been completely migrated to Asynchronous I/O (see https://tokio.rs/ for more information) , removing the previous
implementation based on multiple threads per executor, which caused dead times waiting for data exchange, but still allowing concurrent action processing.
Tornado – Tracing integration
Effectively operating in production environment requires visibility of the system behaviour at runtime. To achieve this goal, with ease, we improved the Tornado logging quality with the introduction of two new features. The first one permits to change the logger level at runtime, so a system administrator is free to increase or reduce the logger level at any moment without restarting Tornado. The second one is the integration of a tracing library that will allow
Tornado to send telemetry data to a Tracing System (e.g. Elastic APM, Jaeger, Zipkin, etc.) to be easily inspected.
SIEM – LogManagement
Real Time Log Signing – Corruptions report
Productively working with a blockchain-based log system requires an adequate set of tools to investigate potential issues. To further facilitate this task, the verification process of the El Proxy now produces a user-friendly report of all corruptions. In addition, each corruption is provided with a unique CorruptionId to be used by the admin for future acknowledgement actions.
Real Time Log Signing – Corruption acknowledgement
To efficiently cope with potential issues in a secured log system, a system administrator needs the ability to acknowledge and fix possible unwanted corruptions. In the last version of the El Proxy, a new acknowledge command allows the administrator to perform this task.
This command, in fact, creates a permanent acknowledge for a specific CorruptionId that restores the status of an invalid blockchain.
Real Time Log Signing – Icinga Director Integration
From this version, users can enable the Real Time Log Signing functionality for each monitored host, via the Icinga Director integration, by setting its properties Enable Logging, Blockchain Enable, and Blockchain Retention.
A dedicated Icinga2 service periodically collects the host properties from the Icinga Director and stores them in Elasticsearch where they can be queried and accessed at log signing time.
Furthermore, to simplify the use of the existing Logstash pipelines and the handling of the Real Time Log Signing, new Beat-specific pipelines (Auditbeat, Filebeat, Winlogbeat) with dedicated inputs, filters, and outputs have been provided.
Real Time Log Signing – Startup Performance Optimization
To reduce startup time of the EBP Log Signing Daemon, and to avoid persistent timeout issues when contacting Elasticsearch after startup on environments with many blockchain elements, the initialization procedure has been optimized. We managed to reduce the average startup time by factor ~300, as seen in the table below, with big indices benefitting disproportionately more form the two applied optimizations.
| Index size | Initial Startup Time (before) | Startup Time after Optimization 1 | Startup Time after Optimization 1+2 (after) |
| 10 million logs | 3300 ms (3.3 s) | 150 ms | 12 ms |
| 20 million logs | 6100 ms (6.1s) | 270 ms | 18 ms |
General
Satellites Support
In NetEye 4.19 we introduced an initial support for Satellites. The secure, TLS-based communication is the first step towards full NetEye Master-Satellite integration. Indeed, from this release, Satellite management is simplified since Update and Upgrade procedure can be easily launched on any Satellite as CLI commands.
The integrity and confidentiality of all communication between NetEye Satellites and the NetEye Master must be guaranteed.
To protect exchanged data from the eyes of both other satellites and also the outside world, we established NATS as the main unified communication channel.
NATS provides an advanced authentication/authorization system that is used to isolate each satellite from others.
The NATS configuration for both the NetEye Master and Satellites is created from new introduced CLI commands that are provided to setup the NetEye Satellites. This way the NetEye Satellite installation is automated.
Additionally, future improvements are already planned in next NetEye releases, to support all the features currently implemented by our customers.
To take advantage of the new infrastructure and to be able to use the new commands, existing Satellites must be migrated to the new configuration.
In NetEye 4.19 we improved communication between Master and Satellite and simplified satellite setup configuring by default Satellite-Master communication to collect and store metrics using Telegraf agents. Satellites automatically establish communication with the Master via NATS, collected metrics will be stored into Influxdb. Each satellite allows Telegraf agents belonging to its zone to send data to NetEye and featured also a local telegraf agent to collect its own metrics.
To help users to set up and maintain NetEye Satellites we have improved the NetEye User Guide in order to provide technical information and useful use cases about NATS and Telegraf on Satellites.

Thomas Forrer
Team Leader Research & Development at Würth IT Italy
Hi folks!
I began loving computer since 1994, it was still the time of windows 3.1. Immediately I learned starting DOS games from the command promt, and while typing some white text on black background I felt like some hackish dude in a hollywoodian movie.
Later during the studies at the university, I discovered the magic world of opensource, and it was love at first sight. Finally I got rid of BSOD's =)
I love everything that is connected to some network, especially in a security perspective.
My motto is:
"With motivation, nothing is impossibile. It only requires more time."
Author
Latest posts by Thomas Forrer
20. 09. 2021
CTF Writeups, SEC4U
RomHack CTF 2021: Table of Contents Writeup