


28. 10. 2025
ITOA, NetEye, Unified Monitoring

02. 12. 2021
Omar Bertò
APM, ITOA, NetEye
Really Slow Login? It’s Not Always the Network, It Might Be Your SQL Server
By using DMVmonitor to analyze query metrics on an MS SQL server instance, I was able to identify a missing index in the SQL server as the root cause of why an application was starting up quite slowly.
In this specific case I was working in a production environment using Microsoft’s Dynamics AX 2012 R3 monitored by NetEye, but in general it applies to a wide variety of other similar environments.
In the space of 24 hours this Citrix web client app’s startup time went from taking 4 seconds on average to taking over a minute, even though the system metrics collected by NetEye showed there were no problems.
Luckily the administrator, before setting out on a long (and costly) analysis of his servers, first checked the sqlXeEvents dashboard, where in just a few seconds he noticed the anomalous difference in a query result compared to the previous day.
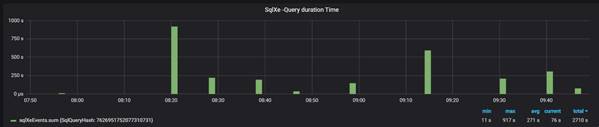
This graph shows the durations in CPU time and elapsed time for the query, using query hash 7626951752077310731 and aggregated by minute.
This dashboard provides details on query_hash and queryplan_hash identified by DMVmonitor so that later it’s possible to recover the actual query string and analyze the execution plan. This is possible both due to the detailed data saved in DMVmonitor as well as directly from the SQL instance.

The Missing Index Hint instantly gives us an answer as to the problem’s origin.
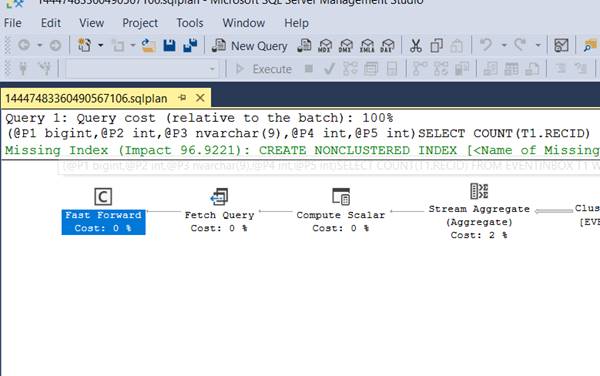
In our case above a select on a custom table that wasn’t properly indexed was the cause of the problem: a nightly batch job was filling this table with thousands of lines, which explains why the next morning its performance was so awful.
You can download and try out DMVmonitor at the following link: https://github.com/zampat/neteye4/tree/itoa_agents/itoa/agents/windows/sqldmvmonitor
Omar Bertò
Author
Latest posts by Omar Bertò
18. 09. 2019
APM, NetEye, Visual Synthetic Monitoring
AX 2012 Intermittent Inventory On-Hand Performance Monitoring and Solution using Alyvix and NetEye SAAS