
ServiceNow
ServiceNow is a digitalization and workflow management platform that provides ITSM (Information Technology Service Management) solutions and, more recently, ITOM (IT Operations Management), ITBM (IT Business Management) and other types of solutions related to the IT world.
In large companies this type of software obviously has a strategic value. They have a complex architecture, are usually distributed in a cluster, and it becomes essential to be able to monitor their main technical parameters to ensure continuity of service. How can we do this?
Monitoring Pages: stats.do and xmlstats.do
ServiceNow offers two pages that provide a lot of useful data for monitoring the health of the application: stats.do and xmlstats.do. These pages take their data both from tables in the application database and by performing some checks. They can be called directly from the URL as follows:
https://[instance name]/stats.dohttps://[instance name]/xmlstats.do
Note: These are administration pages, so they may need an administrator user and password (or token) to be called.
stats.do is a page formatted in HTML (a portion is shown in the figure below):
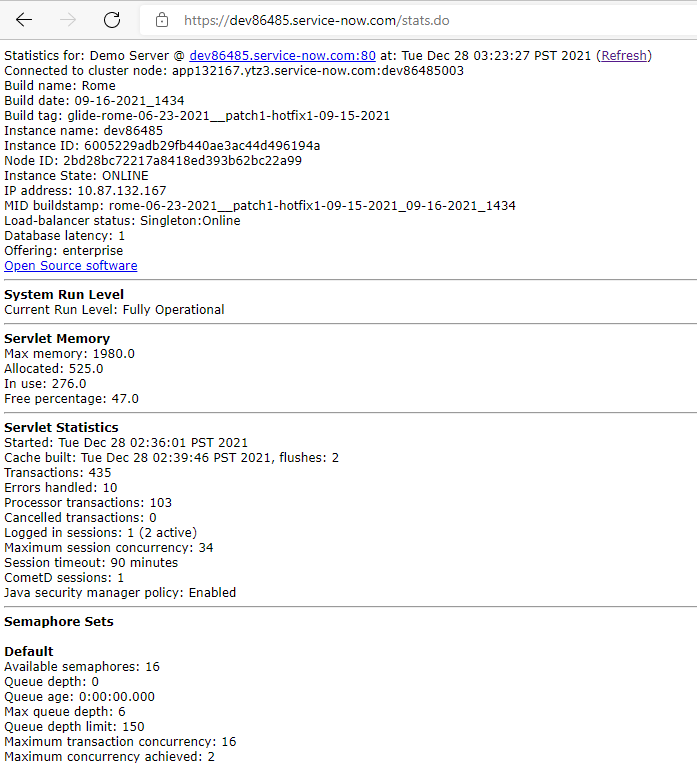
We can see above that we have data on both allocated and in-use memory.
Another important parameter is the semaphores, which are linked to each node of the cluster and by default are “16”. If we have “0” semaphores open in a node, it would mean that we have no resources available and therefore we could temporarily exclude that node from the rotation of the load balancer.
Difference between stats.do and xmlstats.do
The difference between stats.do and xmlstats.do is that the latter, in addition to being formatted in XML, contains a lot more data (and therefore will require a little more resources each time it’s called).
Part of this page is shown in the figure below:
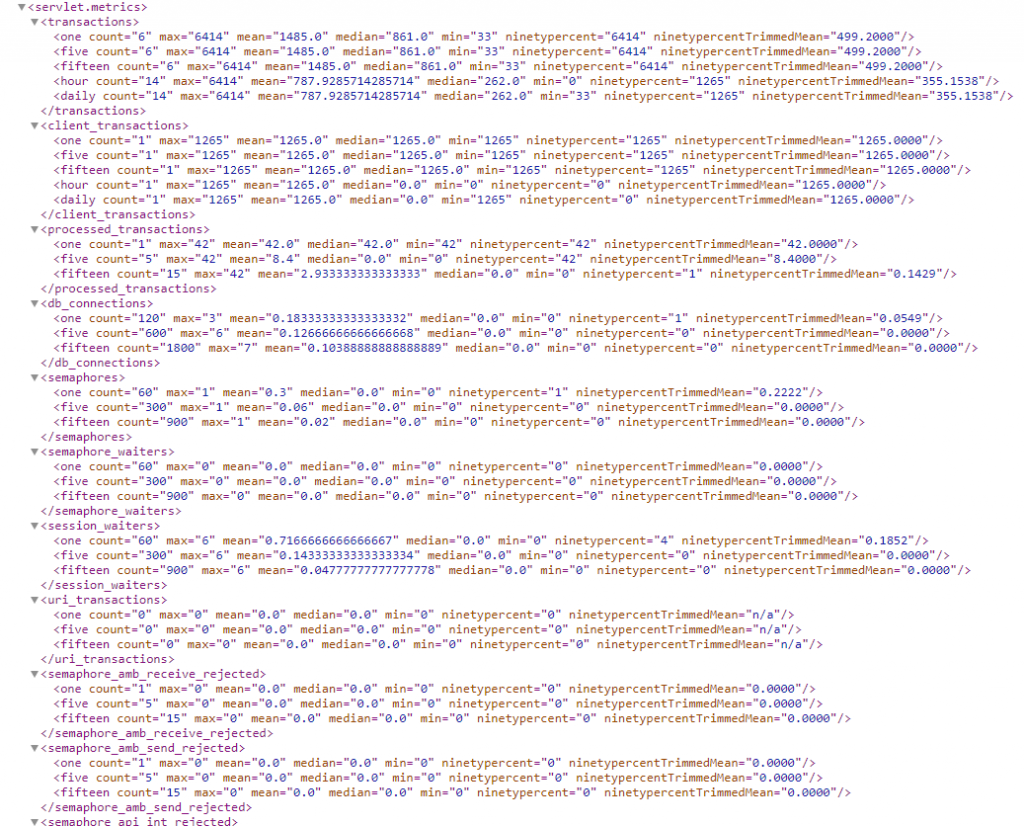
Metrics data
Above we can see a small part of the very interesting metrics that this page provides. For example:

We can see that the observations were made within the time frames: 1 minute (tag one), 5 minutes (tag five), and 15 minutes (tag fifteen).
Within each single metric we find the count (of the connections) and then the minimum and maximum values, the mean, the median, the “ninetypercent” (i.e. the values that are outside 90% of the detected results), and so on.
Therefore, to monitor the application and its performance, it’s sufficient to collect these and many other metrics periodically.
Since the formatting is in XML all we have to do is create a script that through XPATH or a similar method captures the data and passes it through a plugin to a monitoring tool such as NetEye. Below is an example written in Python that uses the library: xml.etree.cElementTree:
def read_data(self,xmlmetrics,path):
        tree=et.fromstring(xmlmetrics)
        result= dict()
        servlet = tree.findall(path)
        for child in servlet:
            sections = dict()
            for tags in child:
                metricname = tags.tag
                timesection = dict()
                for tag in tags:
                    attribute = dict()
                    for attrib in tag.attrib:
                        attribute[attrib]=tag.attrib[attrib]
                    timesection[tag.tag] = attribute
                sections[metricname] = timesection
        result['servlet.metrics'] =sections
        return result
Conclusion
stats.do and xmlstats.do can be very useful tools for application performance management (APM) for ServiceNow. They can be appropriately called periodically with a frequency that guarantees a good level of control over the health of the system without influencing the performance too much.