13. 06. 2022
NetEye, Unified Monitoring

In this article I’ll show you how to use information from NeDi to build network maps using draw.io.
Getting Data from NeDi
NeDi is an open source software tool which discovers, maps and inventories your network devices and tracks connected end nodes. In the NeDI database there are three tables that provide the data needed to build network maps. They are:
- Devices
- Interfaces
- Links
In the devices table the device name is also the primary key. We then have information such as the IP address, the serial number, the description of the vendor, etc.
The interfaces table is linked to the devices table by means of the device name, and contains information relating to each individual interface.
Finally, the most important table for building network maps is: links.
Its fields are:
- id
- device (name of devices)
- ifname (name of interfaces)
- neighbor (name of the neighboring device )
- nbrifname (name of the neighboring interface)
- bandwidth
- linktype
- linkdesc
- nbrduplex
- nbrvlanid
- time
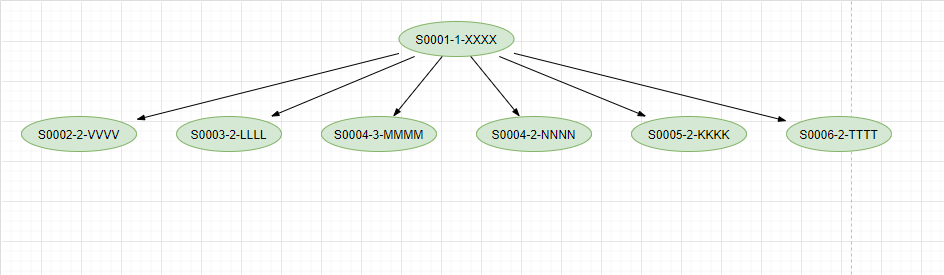
For example, let’s say you have the device: S0001-1-XXXX
To get all the useful information out, we can perform the following queries:
SELECT * FROM devices WHERE device='S0001-1-XXXX'
SELECT * FROM interfaces WHERE device='S0001-1-XXXX15'
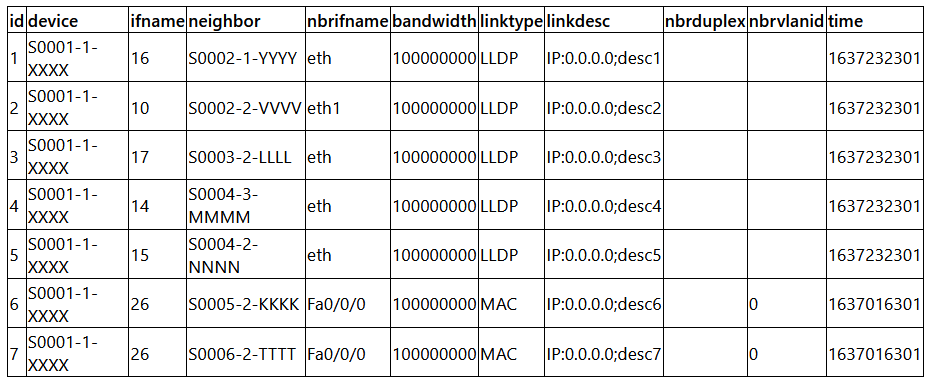
SELECT * FROM links WHERE device='S0001-1-XXXX'
Let’s assume that the result of the third query is the following:
How to build maps with draw.io
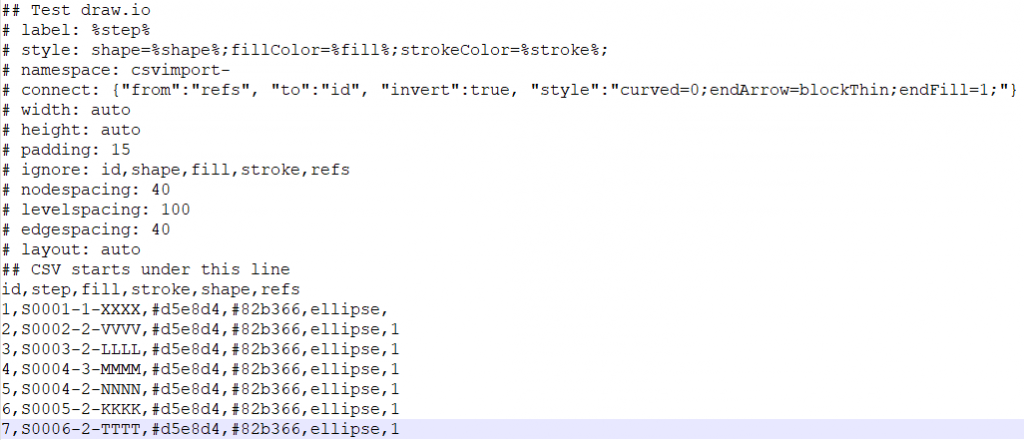
Now that we have the data from NeDi we can use draw.io to build the maps. Following the instructions you can find here, we can build a .csv file from the data in the table above:
So first let’s import the data:
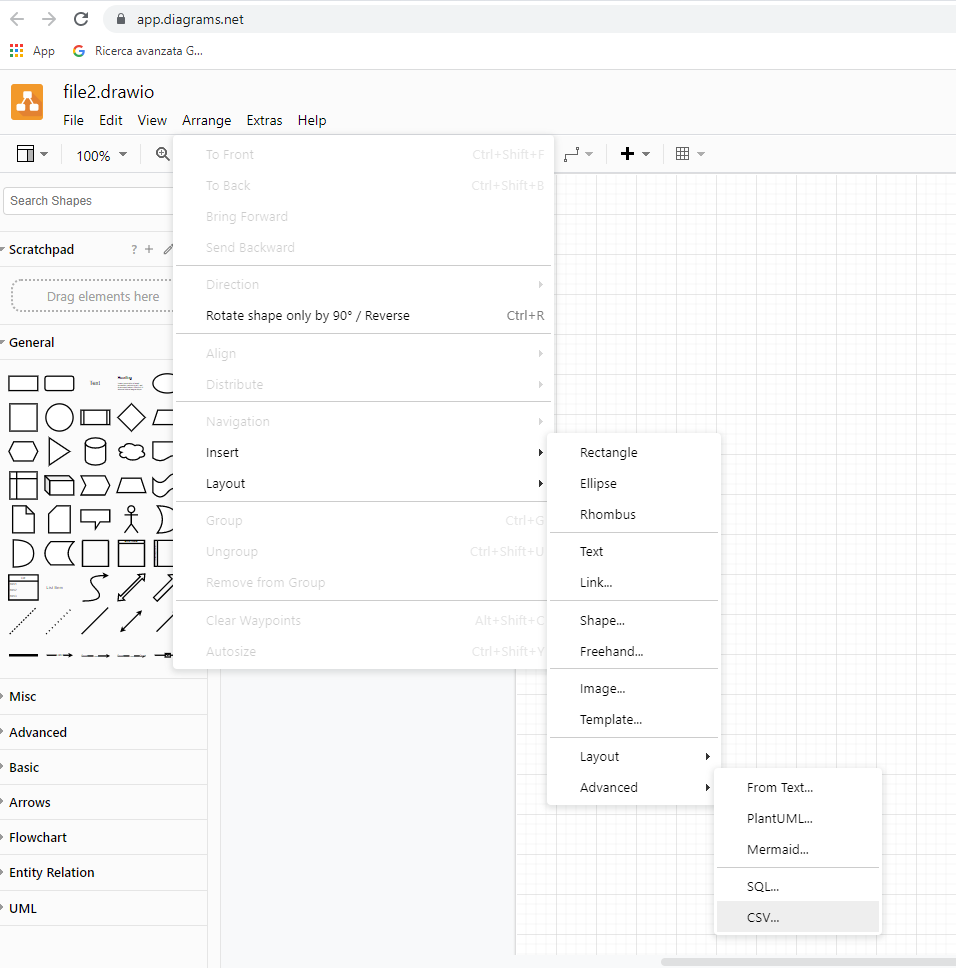
- Go to https://app.diagrams.net/ and click on New … Choose “Blank diagram” and give the map a name.
- Go to Arrange > Insert > Advanced > CSV …
- Copy the contents of the .csv file into the window that appears:
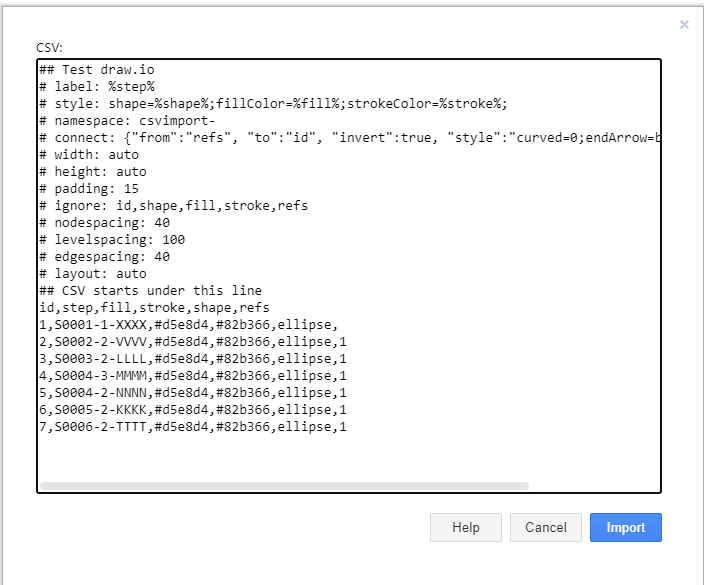
Click “Import” And the final result will be:
Conclusion
The process described above can be easily and conveniently automated with a script, and offers an alternative to producing network maps using the data provided by NeDi.