


02. 04. 2026
NetEye, Unified Monitoring

The correct configuration and scheduling of downtime is an essential element of a monitoring system for several reasons:
- Mitigating notifications
- Providing IT operations and Service Desk teams with timely information about when monitored systems may be subject to faults due to maintenance
- Managing patching, reboot and maintenance procedures that are now typical of all IT systems
Downtimes can be manually configured from the NetEye interface, but they can also be scheduled to run automatically thanks to the Scheduled Downtimes interface available in the Director module.
But how should you proceed in complex environments where there are many hosts which to apply this configuration to?
To try to answer this question I would like to share the approach we took in a recent implementation at a customer.
The IT organization of this customer had defined internal policies for each group of systems, providing for different maintenance windows relating to patching activities, scheduled reboots, backups, etc.
Here are some examples:
- S1 – 8th Day (from 01 to 06 AM)
- S2 – The last Monday (from 01 to 06 AM)
- S3 – 4th Monday (from 01 to 06 AM)
- S4 – 4th Sunday (from 2 to 6 PM)
- S5 – Every Day (from 3 AM to 4 AM)
Starting from this type of schedule, we agreed to make sure that each host monitored in NetEye had an associated policy configured via a dedicated CustomVar, and to exploit this information to “trigger” downtime.
The management process includes the following steps:
- Hosts are regularly updated in NetEye by importing the policy or policies associated with an automation process from the corporate CMDB. These policies are written in a dedicated
CustomVarof each host named update_collection. - The Scheduled Downtimes have been defined following the corresponding timeperiod for each policy and using the
CustomVar(update_collection) as the only filter under “Assign where”.
In this way, each host that has a specific associated policy is automatically put into downtime using the aforementioned rule.
Here are some configuration examples that I hope will also be useful for others when implementing a similar approach.
As reported in the examples above, each customer policy has been associated with a unique code (S1, S2, …). A specific timeperiod has been defined for each of these policies:
- S1: day 8 (01:00-06:00)
- S2: monday-1 (01:00-06:00)
- S3: tuesday-4 (01:00-06:00)
- S4: sunday-4 (14:00-18:00)
For “S5 – Every Day (from 3 AM to 4 AM)”, here are the configured timeperiods:
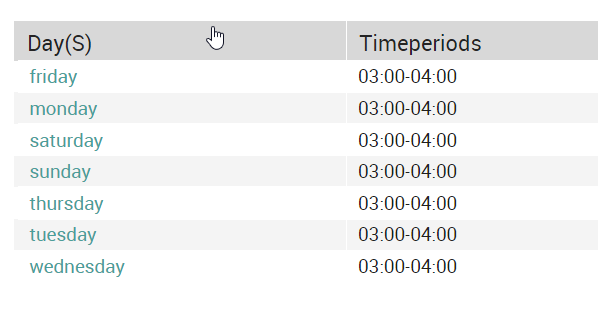
Additional examples on the possible configurations of timeperiods can be found here.
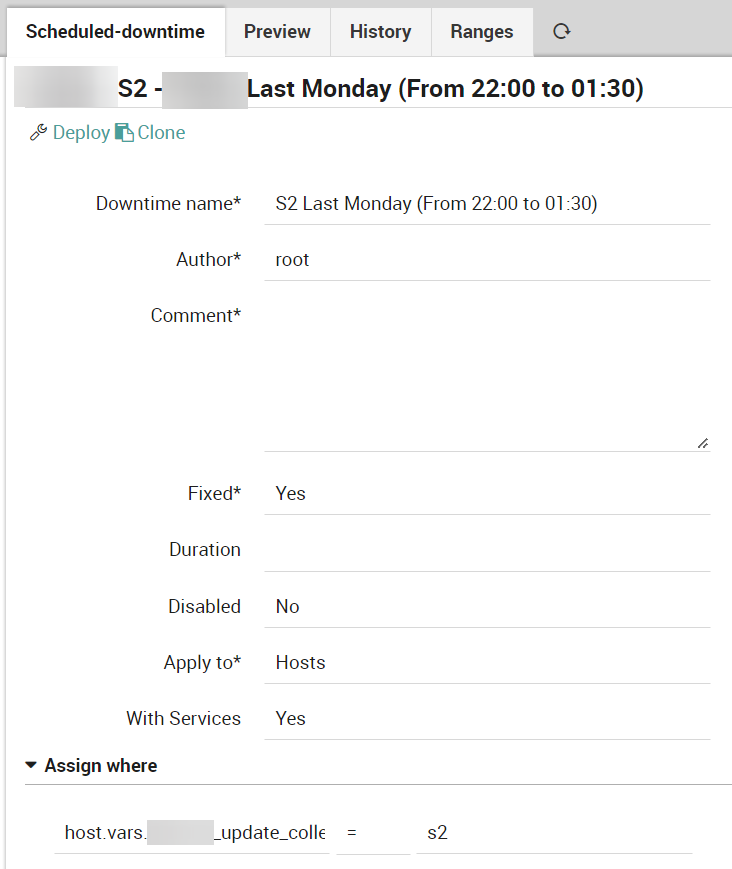
Below is an example of scheduled downtime configured in Director where you can see the filter used in the “Assign where” rule:
And finally, an example of a host with active scheduled downtime:
These Solutions are Engineered by Humans
Did you find this article interesting? Does it match your skill set? Our customers often present us with problems that need customized solutions. In fact, we’re currently hiring for roles just like this and others here at Würth Phoenix.

Giuseppe Di Garbo
Consultant at Würth IT Italy
Hi everybody. I’m Giuseppe and I was born in Milan in 1979. Since the early years of university, I was attracted by the Open Source world and operating system GNU\Linux. After graduation I had the opportunity to participate in a project of a startup for the realization of an Internet Service Provider. Before joining Würth Phoenix (now Würth IT Italy) as SI consultant, I gained great experience as an IT consultant on projects related to business continuity and implementation of open source software compliant to ITIL processes of incident, change and service catalog management. My free time is completely dedicated to my wife and, as soon as possible, run away from Milan and his caotic time and trekking discover our beautiful mountain near Lecco for relax and lookup the (clean) sky.
Author
Latest posts by Giuseppe Di Garbo
19. 12. 2025
Atlassian, Service Management
Jira Service Management Customer Detail Fields: A Practical Use Case
29. 09. 2025
Atlassian, Service Management
Streamlining Service Request Management with ITIL4 and Jira Service Management
30. 06. 2025
Atlassian, Service Management
Creating Jira Service Management Requests from a Public Website? Here’s the Secure, No-API Way
28. 03. 2025
Atlassian, Service Management
Effortless On-Call Management with Jira Service Management