
Monitoring systems acquire information from various devices in different ways: API, SNMP, syslog, etc.
One of the most important methods in Icinga-based systems like NetEye is the Icinga Agent. This agent is installed on each server and collects and sends information to the master NetEye node using secure protocols.
When we work within a small ecosystem it’s quite easy to remember which agents we’ve installed and where we’ve installed them. But when the number of servers increases significantly (think hundreds or thousands of servers) it’s not so easy to manage them, especially if we’re not using software for orchestration such as DSC, Ansible, etc.
To solve this issue, we developed the Grafana dashboard below, based on an Icinga check that uses the icinga command. This plugin/service is provided out-of-the-box via our NEP, or can be easily copied from our online demo system.
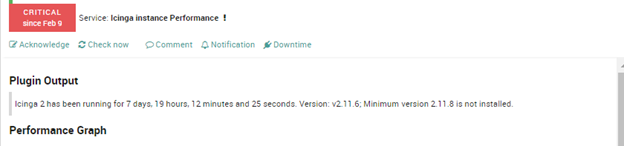
This check is used to compare the installed version with a specific version, but in the Plugin Output section it also provides useful information about the installed version:
Icinga 2 has been running for 7 days, 19 hours, 18 minutes and 25 seconds. Version: v2.11.6; Minimum version 2.11.8 is not installed.
The plugin output data is then managed and filtered via an SQL query using some REGEX functions such as REGEXP_SUBSTR and REGEXP_REPLACE. Here’s an example query:
SELECT
REGEXP_REPLACE ( REGEXP_SUBSTR(output, '(Version:\\s+(\\S*))'), 'Version: r|Version: v|Version: |;', '') AS "Agent Version",
COUNT(*) AS "Total"
FROM icinga_servicestatus i_s
LEFT JOIN icinga_objects i_o ON i_s.service_object_id=i_o.object_id
WHERE check_command = "icinga"
AND LOWER(name2) LIKE "icinga instance performance"
AND REGEXP_REPLACE ( REGEXP_SUBSTR(output, '(Version:\\s+(\\S*))'), 'Version: r|Version: v|Version: |;', '')  IN  (${Version})
AND NOT (LOWER(output) LIKE "%is not connected to%" OR LOWER(output) LIKE "%exception%")
AND is_active=1
GROUP BY (REGEXP_REPLACE ( REGEXP_SUBSTR(output, '(Version:\\s+(\\S*))'), 'Version: r|Version: v|Version: |;', ''))
ORDER BY COUNT(*) DESC;
The dashboard then reads this information from MariaDB and plots it in several graphs and tables. With these an operator can see a summary of all installed versions of the agent, the number of times they occur, and also check where and what they are installed on. Using the filter at the top of the dashboard the information can also be filtered by a target version.
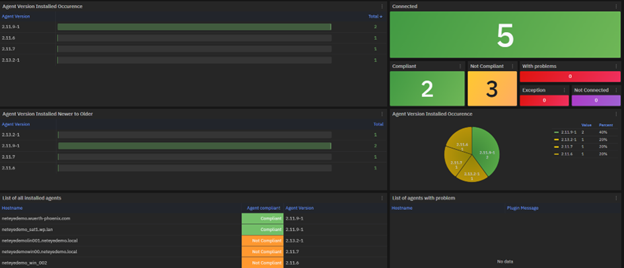
We’re continually improving this dashboard, and if you’d like to run it in your data center, please download a copy from our online demo system, or just ask us!


