


11. 03. 2026
Blue Team, Log-SIEM, SEC4U, Threat Intelligence

Starting in January I was offered the following challenge: Help customers use their NetEye system differently, that is, help customers exploit the potential of our system to move from a use that’s strictly related to monitoring to one more oriented towards the security arena, that is, creating a system in-house that can help them implement the logic required by an SOC service.
We thus decided to put together the knowledge that we already have in order to get an SOC service up and running for these customers.
Let’s look at the steps to follow to be able to respond to this explicit need.
First of all, you need to check whether the customer’s NetEye system has the appropriate characteristics both at the computational and storage level. Normally for this type of system, a 3-node cluster with a sub SIEM license is recommended, which allows you to have up to the Elastic Enterprise license.
Then the consultant on duty, in this case me, collects the various elements that can be useful to an SOC service by building a perimeter and sharing it with my colleagues in the internal SOC to check which data sources to collect.
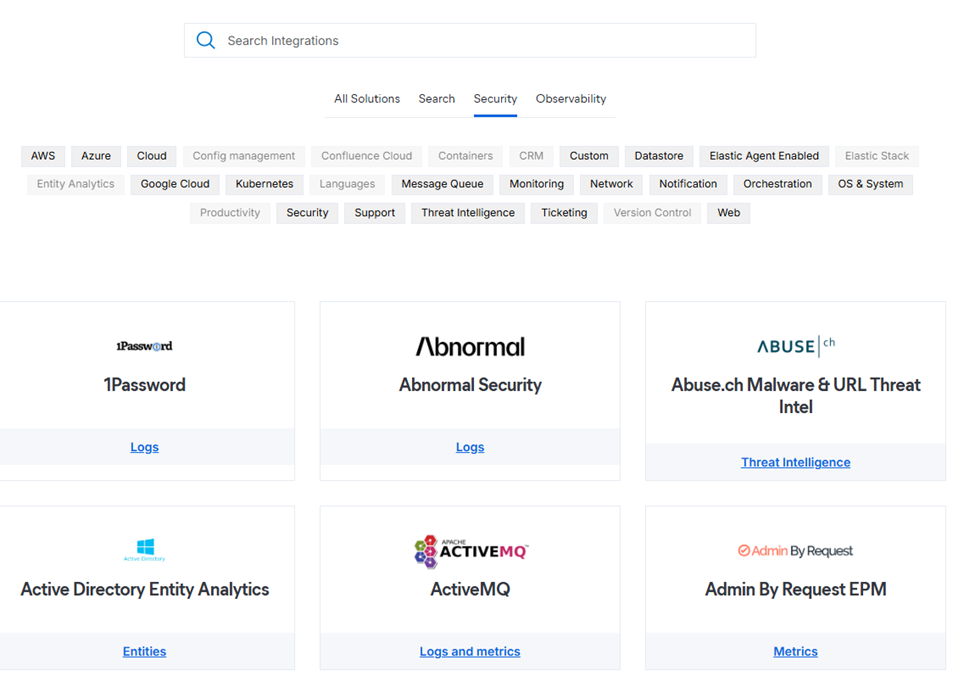
Once we’ve collected those data sources, which can range from firewalls to Active directories, LDAP, switches, routers, Linux servers, Windows servers, antivirus, EDR, XDR, and cloud consoles provided by Microsoft, Google or others, we proceed to configure the system with 4 hands. I configure the various integrations made available by our system and the customer configures their devices so that we can collect the first logs. Here the link for the integration Elastic integrations | Elastic.
This is pretty rare nowadays though, customers often already have their own EDR/XDR solution and we can just use theirs. The reason why you cannot use more than one solution at a time is that in many cases they block each other.
If instead a customer does not have their own EDR, we provide Elastic Defend with our subs.
Elastic Defend provides organizations with prevention, detection, and response capabilities with deep visibility for EPP, EDR, SIEM, and Security Analytics use cases across the Windows, macOS, and Linux operating systems running on both traditional endpoints and public cloud environments. You can use Elastic Defend to:
- Prevent complex attacks – Prevent malware (Windows, macOS, Linux) and ransomware (Windows) from executing, and stop advanced threats with malicious behavior (Windows, macOS, Linux), memory threats (Windows, macOS, Linux), and credential hardening (Windows) protections. All powered by Elastic Labs and its global community.
- Alert in high fidelity – Bolster team efficacy by detecting threats centrally and minimizing false positives via extensive corroboration.
- Detect threats in high fidelity – Elastic Defend facilitates deep visibility by instrumenting the process, file, and network data in your environments with minimal data collection overhead.
- Triage and respond rapidly – Quickly analyze detailed data from across your hosts. Examine host-based activity with interactive visualizations. Invoke remote response actions across distributed endpoints. Extend investigation capabilities even further with osquery integration, fully integrated into Elastic Security workflows.
- Secure your cloud workloads – Stop threats targeting cloud workloads and cloud-native applications. Gain real-time visibility and control with a lightweight user-space agent, powered by eBPF. Automate the identification of cloud threats with detection rules and machine learning (ML). Achieve rapid time-to-value with MITER ATT&CK-aligned detections honed by Elastic Security Labs.
- View terminal sessions – Give your security team a unique and powerful investigative tool for digital forensics and incident response (DFIR), reducing the mean time to respond (MTTR). Session view provides a time-ordered series of process executions in your Linux workloads in the form of a terminal shell, as well as the ability to replay the terminal session.
For the next step I configure the various agents to be distributed on the various systems that allow the use of agents. There are essentially two agents, Icinga 2 Agent and Elastic Agent, and the customer takes care of distributing them across his systems. In parallel, NetEye is configured for both the Icinga and Elastic parts to be able to receive information from these systems.
We make the most of fleet management, which allows us to update the various agents directly from the console without having to connect to the system every time.
Subsequently, we proceed to verify the space occupied by the logs and verify the retention for each type of data based on the customer’s needs and the amount of storage present in the system.
Once this analysis has been done, we activate the retention levels on the system.
In parallel, we provide assistance on detection rules, and for our customers we also share rules we’ve developed internally.
We also train the people who will actually be monitoring the SOC service. For this reason, customers typically plan to hire SOC analysts who will carry out daily analyses on the alarms detected in the system to improve the rules and try to attenuate the background noise of some alarms. This part allows the customer to improve their knowledge of their infrastructure and add or reduce rules based on their needs. In some cases, we also proceed to create new test rules or use other rules provided by us or by Elastic to see if these can also meet their needs.
The last part is the management of alarms. The alarms can be initially processed manually by the operator, or it’s possible to open tickets for example on JIRA to check regularly. Other interesting integrations are the possibility of sending an alert directly to the Hive, or other security-related integrations that are made available by the system. If you have a custom platform there isn’t a problem, you can proceed to configure a webhook to send the information directly to it.
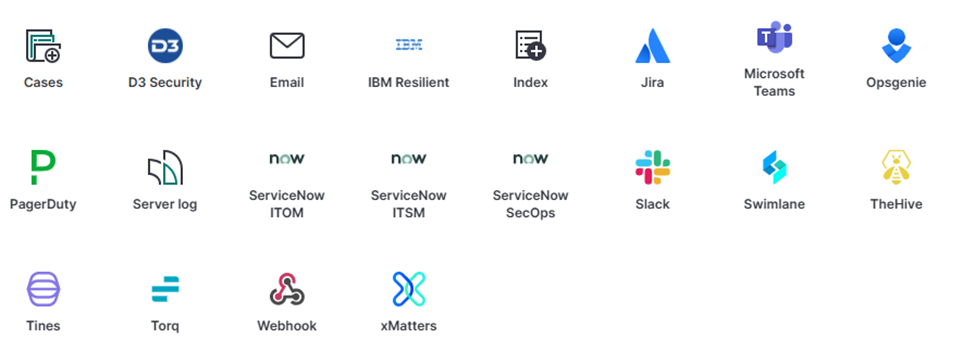
In order to configure alerts in NetEye we use the Webhook as an action which, through another component of our Tornado suite, executes the action that the client prefers, whether it’s creating a new service or putting an existing service or host in red status.
I had the opportunity to follow a couple of customers on this journey which obviously doesn’t stop here, but we’ll continue to check and evolve together.
Franco Federico
Hi, I’m Franco and I was born in Monza. For 20 years I worked for IBM in various roles. I started as a customer service representative (help desk operator), then I was promoted to Windows expert. In 2004 I changed again and was promoted to consultant, business analyst, then Java developer, and finally technical support and system integrator for Enterprise Content Management (FileNet). Several years ago I became fascinated by the Open Source world, the GNU\Linux operating system, and security in general. So for 4 years during my free time I studied security systems and computer networks in order to extend my knowledge. I came across several open source technologies including the Elastic stack (formerly ELK), and started to explore them and other similar ones like Grafana, Greylog, Snort, Grok, etc. I like to script in Python, too. Then I started to work in Würth Phoenix like consultant. Two years ago I moved with my family in Berlin to work for a startup in fintech(Nuri), but the startup went bankrupt due to insolvency. No problem, Berlin offered many other opportunities and I started working for Helios IT Service as an infrastructure monitoring expert with Icinga and Elastic, but after another year I preferred to return to Italy for various reasons that we can go into in person 🙂 In my free time I continue to dedicate myself to my family(especially my daughter) and I like walking, reading, dancing and making pizza for friends and relatives.
Author
Latest posts by Franco Federico
10. 03. 2026
Unified Monitoring
Elastic AutoOps in NetEye: Simplifying Elasticsearch Operations with Real-Time Intelligence
09. 09. 2025
NetEye
Backing up a MariaDB Galera Cluster
17. 02. 2025
Unified Monitoring
Monitoring Printer Logs
10. 12. 2024
Log-SIEM
Let’s Discover ES|QL