End User Experience and traditional monitoring: a perfect match
One of the main challenge in the IT monitoring is the ability to execute complex web service tests to obtain objective KPI able to evaluate the end user experience.
As every company we also needed to control our web applications such as the Exchange 2013, our Service Desk solution EriZone powered by OTRS, our reporting module, our website or our blog – the one that you are reading 🙂
Based on these premises, we designed a new monitoring structure in NetEye, by implementing the execution of the End User Experience controls. We have integrated the Sahi checks (tool for the web application automation) into NetEye and PHANTOMJS that allows to execute the test cases without launching any browser.
With this solution it is possible to execute the test cases for an entire flow to control the services exactly how they are experienced by the users. To better understand this concept, I will now provide you an example.
In our case, for instance, we wanted to check our email service. What we have done, is to create a test that checks the connection to the webmail (in HTTPS), the loading of the homepage where the user credentials are inserted and the user is finally authenticated.
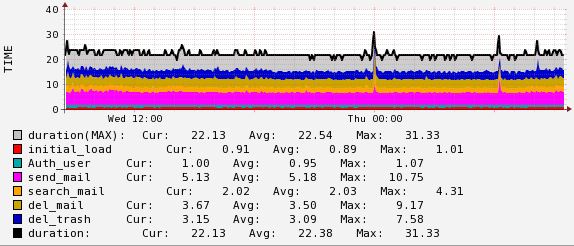
At this point, we create an email, that is sent to the same authenticated user, the email is searched out in the inbox folder, deleted and cleared also from the trash. The test is executed every 5 minutes that means 288 email daily. In the following list, I’ll provide the checks that have been executed:
- User_Authentication_Check
- Send_Email_Check
- Search_Email_Check
- Delete_Email_Check
- Delete_Trash_Check
- Duration
By performing this test it is possible to guarantee that the email service is available and it is performed in certain time range. For every step, in fact, it will be registered and archived the execution time. If the time is above a certain preconfigured threshold an alarm will be generated by the monitoring system.

The test case execution time are registered and archived in NetEye, offering the possibility to view the performance trend of the service.
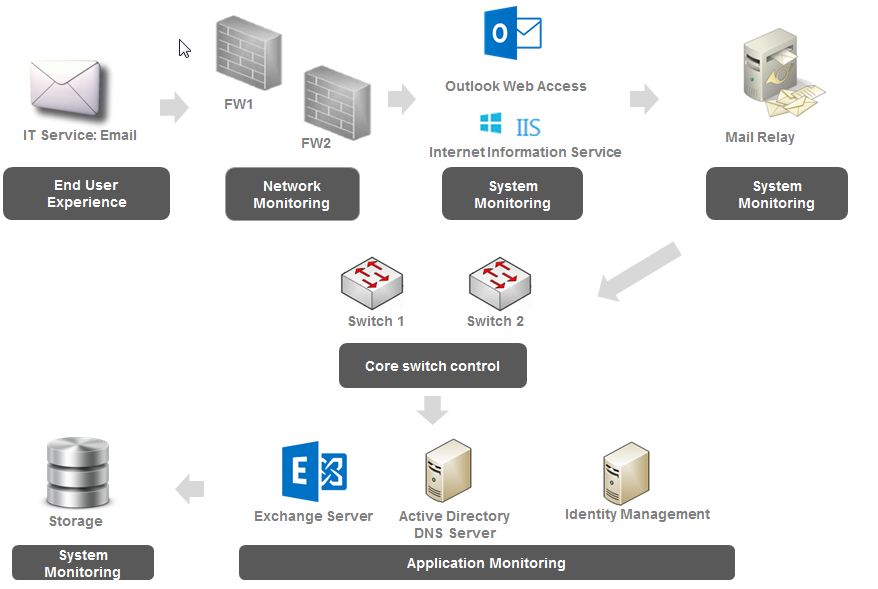
With this kind of test it is possible to ensure indirectly also that the entire involved infrastructure is working properly, as shown in the image below.

The combination between the End User Experience and the traditional monitoring can guarantee a 360 degrees overview of the IT infrastructure and to ensure that the services are delivered with certain performance levels.
It is therefore sufficient to monitor the End User Experience? Obviously it is not enough, but the traditional monitoring combined with the innovative End User Experience, can give a 360 degree overview of the services (just how they are perceived by users) and ensure that the infrastructure and its components are working properly and that the users are satisfied.


