


25. 03. 2026
Atlassian, NetEye, Unified Monitoring

Da neben den namhaften Platzhirschen wie Cisco, HP und Juniper auch Huawei immer größere Verbreitung im Bereich der Netzwerkgeräten findet, habe ich diesen Umstand zum Anstoß genommen einen Huawei 2751 S2751-28TP-PWR-EI-AC an eine NetEye-Appliance anzuschließen und zu testen welche Informationen auslesbar sind.
Bei dem von mir getesteten Gerät handelt es sich um einen Switch mit 24 100Mbit Ports und 4 Gigabit Ports.
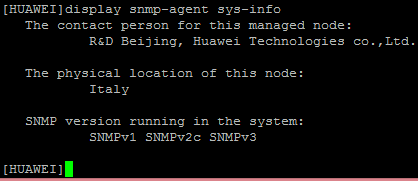
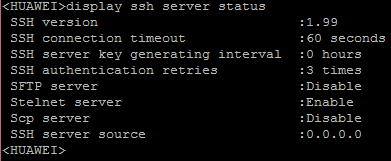
Zur Vorbereitung muss eine Grundkonfiguration vorgenommen werden dabei ist darauf zu achten, dass auch der SNMP-Agent und eine SSH–Konfiguration aktiv sind.
Das erste Tool der NetEye-Suite welches Informationen aus dem Switch bezieht ist das auf NeDi basierende Discovery-Modul.
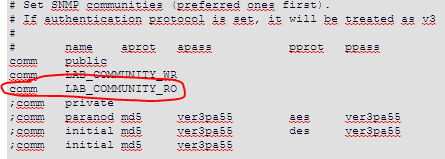
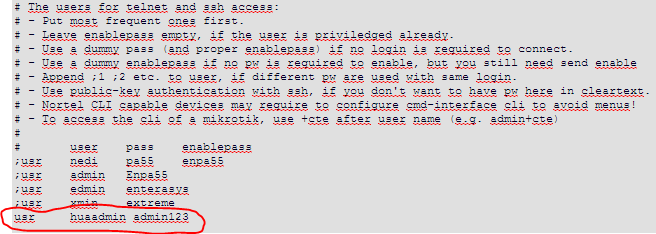
Um die Daten vom Switch abzufragen müssen im File nedi.conf einige Einstellungen angepasst werden.
- Die SNMP Community:
2. CLI-Zugang aktivieren
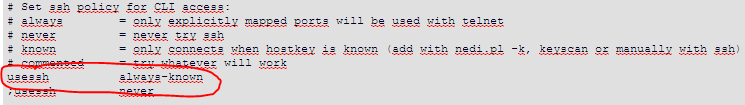
3. SSH-Zugangsdaten
Wenn man nun ein Discovery auf den Switch ausführt, wird schon eine merkliche Flut an Daten übermittelt und im NetEye Discovery angezeigt.
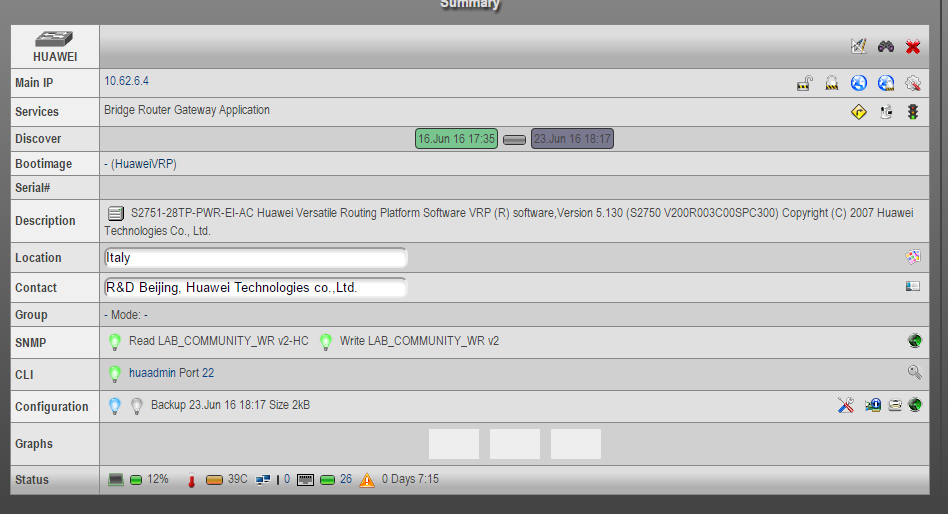
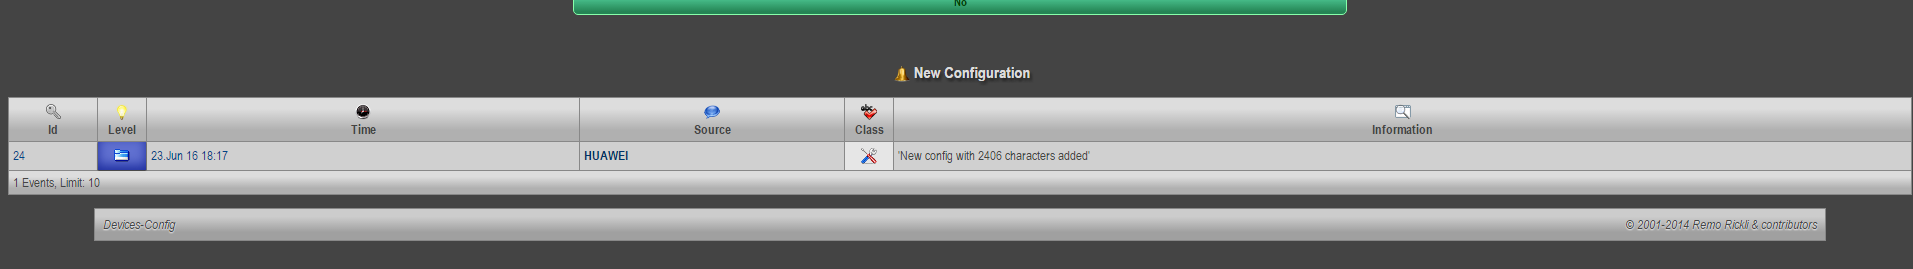
Da wir auch einen SSH-Zugang und den CLI- Zugang aktiviert haben kann NeDi die Konfiguration des Switches sichern und auf dem NetEye Server ablegen, um danach wieder eingespielt oder mit folgenden Konfigurationen verglichen werden zu können.
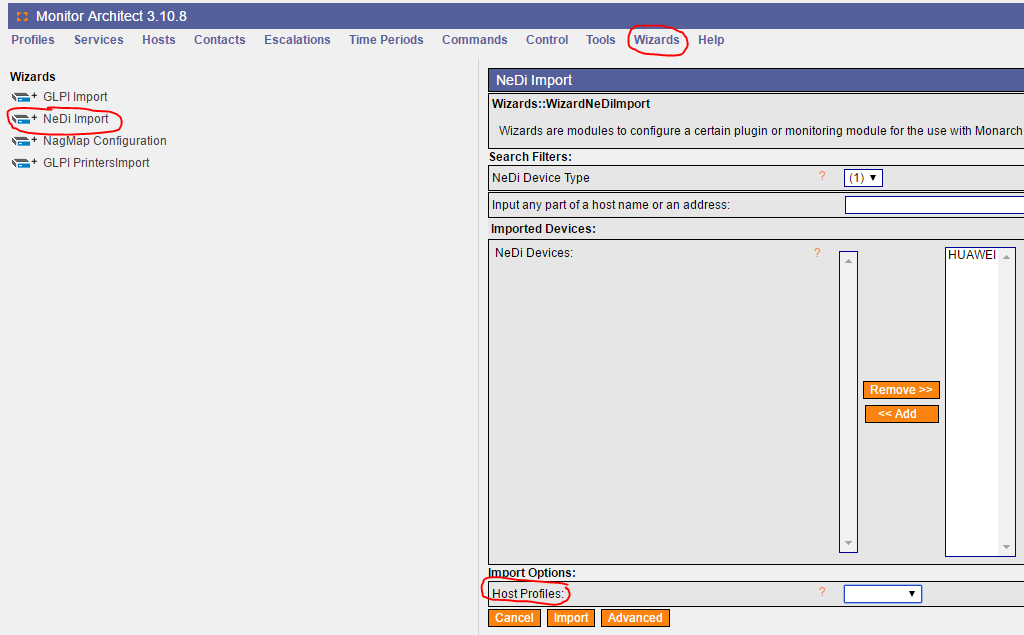
Nachdem der Huawei Switch nun erfasst und aufgenommen wurde können wir das Gerät ins Monitoring aufnehmen und mit den dafür vorgesehenen Checks überwachen.
Die einfachste Methode um das Gerät zu importieren ist der Wizard „NeDi Import“ welcher dabei hilf Geräte aus NeDi ins NetEye-Monitoring zu importieren und ihm dabei ev. ein Hostprofile zuzuweisen.
Sobald der Switch aufgenommen wurde kann man Ihn mit den dafür vorgesehenen Checks abfragen.
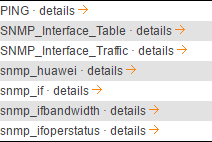
Da schon für NeDi SNMP aktiviert wurde, kann dieses Protokoll nun auch für die Überwachung genutzt werden.
Die oben gelisteten Checks wurden getestet und liefern Resultate welche in graphischer Darstellung durch PNP4Nagios veranschaulicht werden.
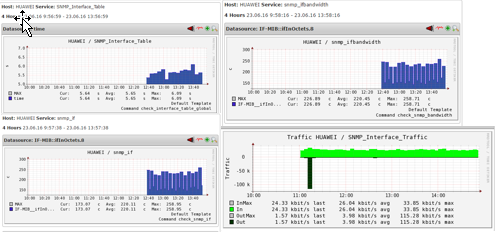
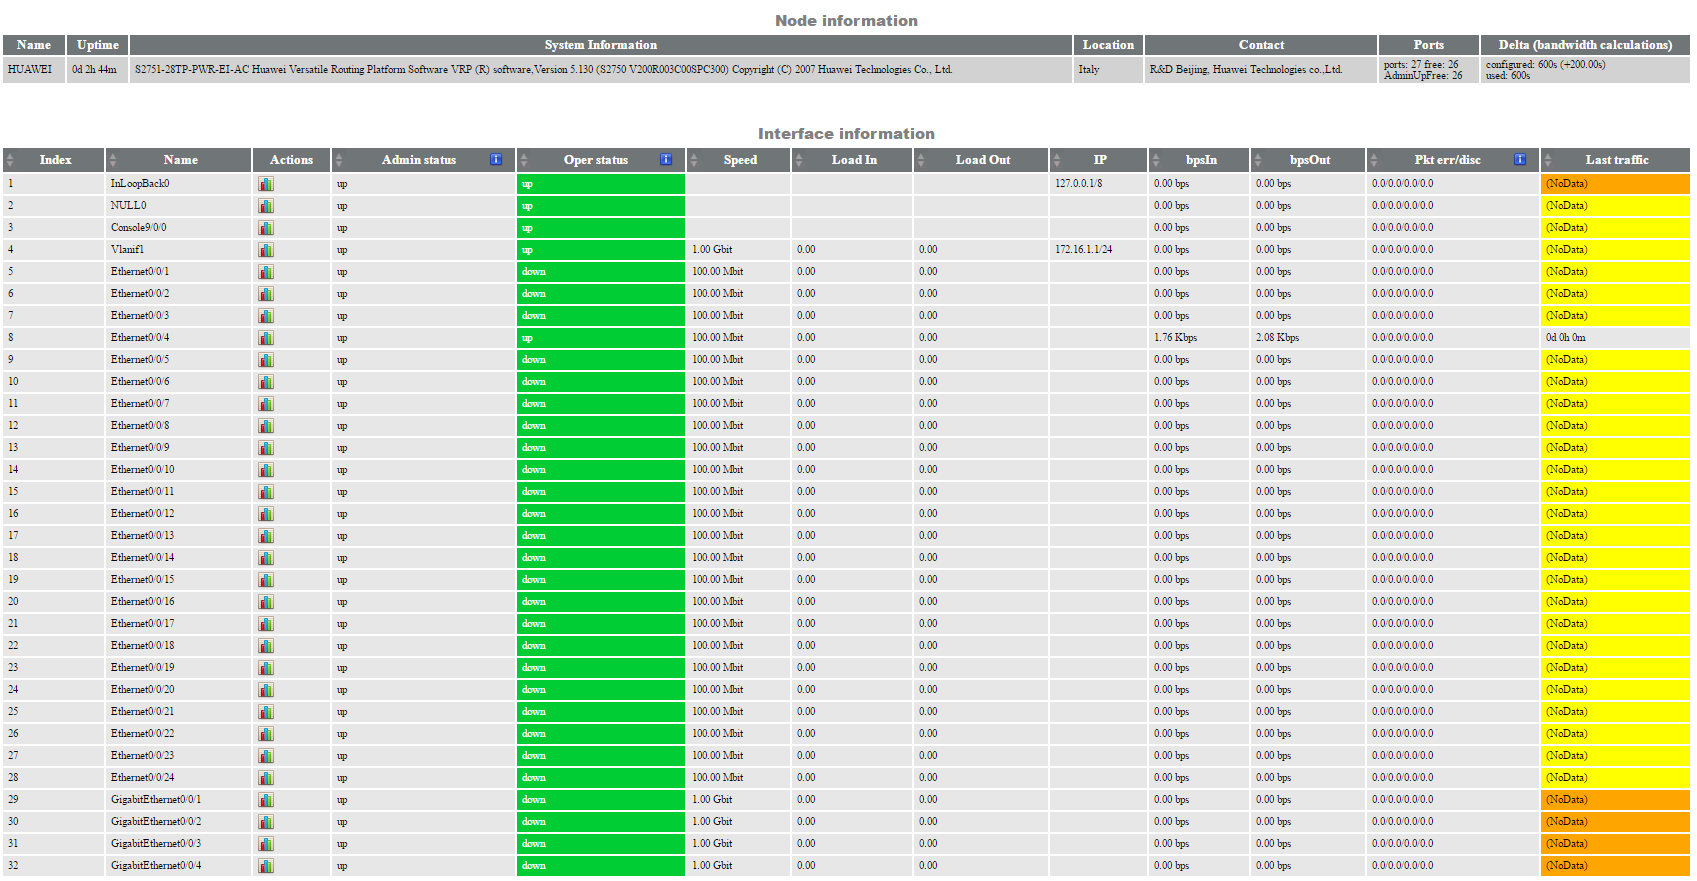
Der Check „SNMP_Interface_Table“ zeigt eine Übersicht wichtiger Informationen und kann durch eine korrekte Konfiguration auf die Abweichung/Änderung von Standardwerten hinweisen.
Dies war ein Überblick der Abfragen die ich an den Switch gerichtet habe. Ich hoffe dieser Beitrag war verständlich und hilfreich.

Patrick Agreiter
Hi, I’m Patrick.
Since I was a little boy i love to diassemble and reassemble things...
So I did with my first 386SX back in the 80s... and I still do with my i7 up till now.
I worked in the Service Desk then grew up to a DBA and work now as Integration Consultant at Würth Phoenix.
Author
Latest posts by Patrick Agreiter
23. 08. 2016
NetEye
Facility Monitoring: NetEye stretches its feelers
19. 08. 2016
NetEye
Un giorno con Huawei …. e NetEye
19. 08. 2016
NetEye
One Day with Huawei …. and NetEye