
23. 08. 2016
Patrick Agreiter
NetEye
Facility Management: Lasciate allungare a NetEye i suoi sensori
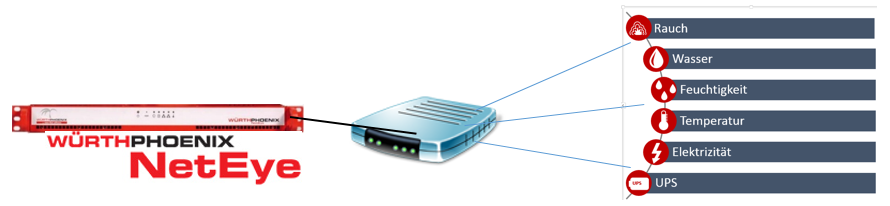
Come per ogni buon sistema di monitoraggio, anche NetEye ha i suoi sensori ambientali (fumo, temperatura, umidità, acqua e altri), quindi, perché cercare un’altra soluzione e non usare la propria? A tale scopo NetEye fornisce una scatola (Box) configurabile, che può essere popolata con 4 o 12 sensori. La Box viene collegata e configurata per la rete via cavo Ethernet.
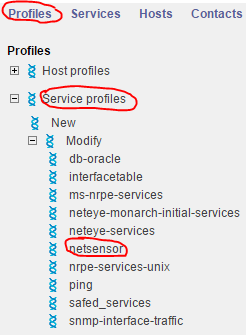
In seguito il profilo “Netsensor”, previsto nel monitoraggio NetEye, può essere utilizzato per interrogare i valori della Ethernet Box.
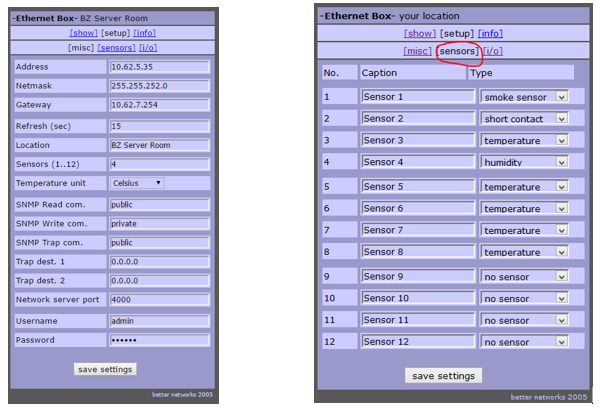
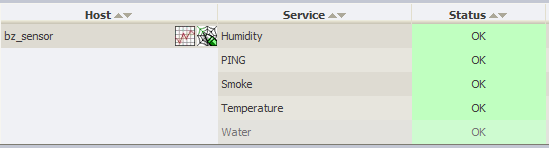
La Ethernet Box è configurabile sia per quanto riguarda le impostazioni IP che per la disponibilità del sensore.
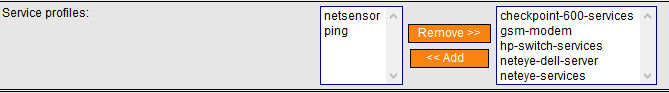
NetEye fornisce già un profilo predefinito sia per Host che per servizio, che può essere assegnato alla EthernetBox.
I sensori mostrano una violazione delle soglie.
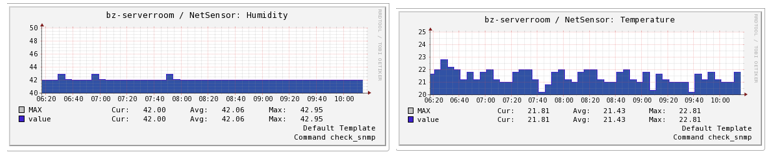
Inoltre indicano un percorso continuo di valori.
Come e dove è possibile utilizzare questa soluzione?
Esempi:
Sensore di temperatura:
- Rilevazione di un aumento della temperatura nella stanza del server (può indicare un malfunzionamento del dispositivo di raffreddamento)
- Rilevazione di un aumento di temperatura in una cella frigorifera (può rilevare che qualcuno ha dimenticato di chiudere la porta)
Sensore di contatto:
- Rilevamento di una porta non chiusa (analisi causa principale per l’aumento di temperatura)
- Rilevamento di un’ intrusione o un accesso non autorizzato
Sensore di fumo:
- Rilevamento di fumo
Sensore di acqua:
- Rilevamento di una perdita d’acqua
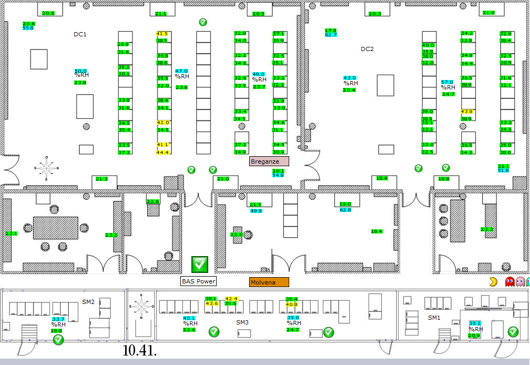
Come si può vedere, ci sono molte applicazioni per il monitoraggio ambientale tramite sensori. Grazie alla capacità di NetEye di gestire molte di queste box, si offre all’utente la possibilità di crearsi un’immagine completa delle aree da monitorare
In questo senso, lasciate allungare a NetEye i suoi sensori…


Patrick Agreiter
Hi, I’m Patrick.
Since I was a little boy i love to diassemble and reassemble things...
So I did with my first 386SX back in the 80s... and I still do with my i7 up till now.
I worked in the Service Desk then grew up to a DBA and work now as Integration Consultant at Würth Phoenix.
Author
Latest posts by Patrick Agreiter
23. 08. 2016
NetEye
Facility Monitoring: NetEye stretches its feelers
19. 08. 2016
NetEye
Un giorno con Huawei …. e NetEye
19. 08. 2016
NetEye
One Day with Huawei …. and NetEye
19. 08. 2016
NetEye
One Day with Huawei …. und NetEye