

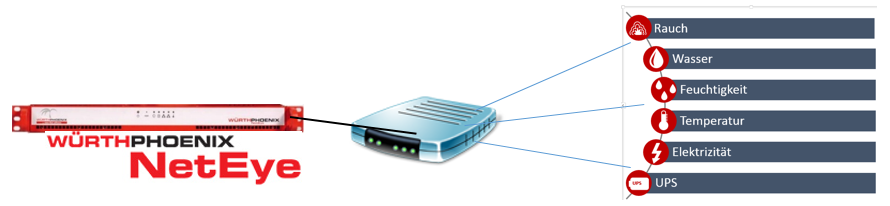
As it should be for a good monitoring system, NetEye has its environmental sensors (smoke-, temperature-, humidity-, water- and more), so why looking elsewhere instead of using your existing solution? NetEye for this purpose provides a configurable box, which can be populated with either 4 or 12 sensors. The box is connected via Ethernet cable to the network and can be then configured.
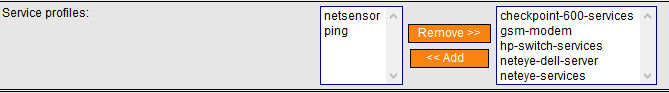
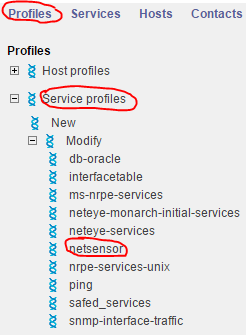
The “Netsensor” Profile, provided in the NetEye Monitoring, can be used to query the values of the Ethernet Box.
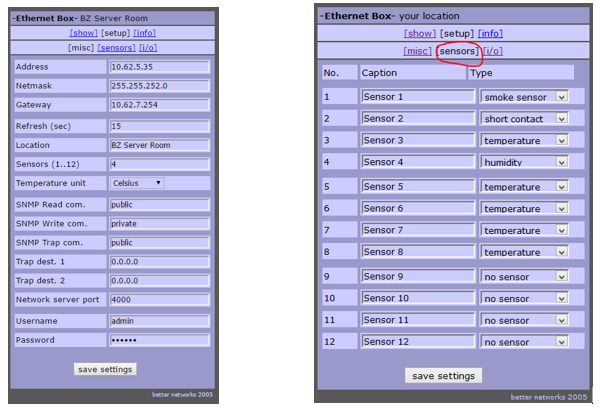
The Ethernet Box is configurable regarding IP settings and sensor availability.
NetEye is already providing a predefined Host + Service profile, which can be assigned to the Ethernet Box.
The sensors indicate exceeded thresholds
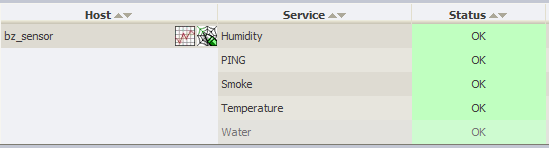
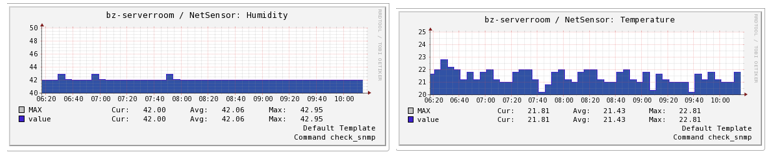
They are also showing the continuous state of the values.
How and where can this solution be used?
Application examples:
Temperature sensor:
- Detection of a temperature rise in the server room (may indicate a malfunction of the cooling system)
- Detection of a temperature rise in the reefer (may indicate that someone forgot to close the door)
Contact sensor:
- Detection of an unclosed door (root cause analysis for temperature rise)
- Detection of an intrusion or an unauthorized access
Smoke sensor:
- Detection of smoke emission
Water sensor:
- Detection of a water leak
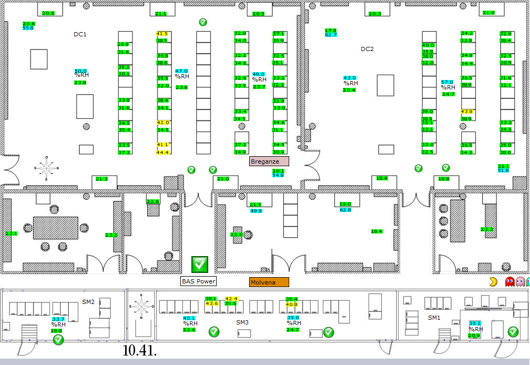
As you can see, there are many possible applications for environmental monitoring through sensors. The fact, that NetEye also can manage several of these boxes, gives the user the possibility to create a complete image of the facilities he has to monitor.
In this sense, let NetEye stretch its feelers….


Patrick Agreiter
Hi, I’m Patrick.
Since I was a little boy i love to diassemble and reassemble things...
So I did with my first 386SX back in the 80s... and I still do with my i7 up till now.
I worked in the Service Desk then grew up to a DBA and work now as Integration Consultant at Würth Phoenix.
Author
Latest posts by Patrick Agreiter
19. 08. 2016
NetEye
Un giorno con Huawei …. e NetEye
19. 08. 2016
NetEye
One Day with Huawei …. and NetEye
19. 08. 2016
NetEye
One Day with Huawei …. und NetEye