Easily Connect EriZone with Power BI Desktop to Create Effective Dashboards
It is said that a picture is worth a thousand words; in the case of data representation, this is even more true.
Let’s take a step back and focus on the data.
When analyzing or reviewing a ticketing system, it may be that simple questions do not have easy answers. For example:
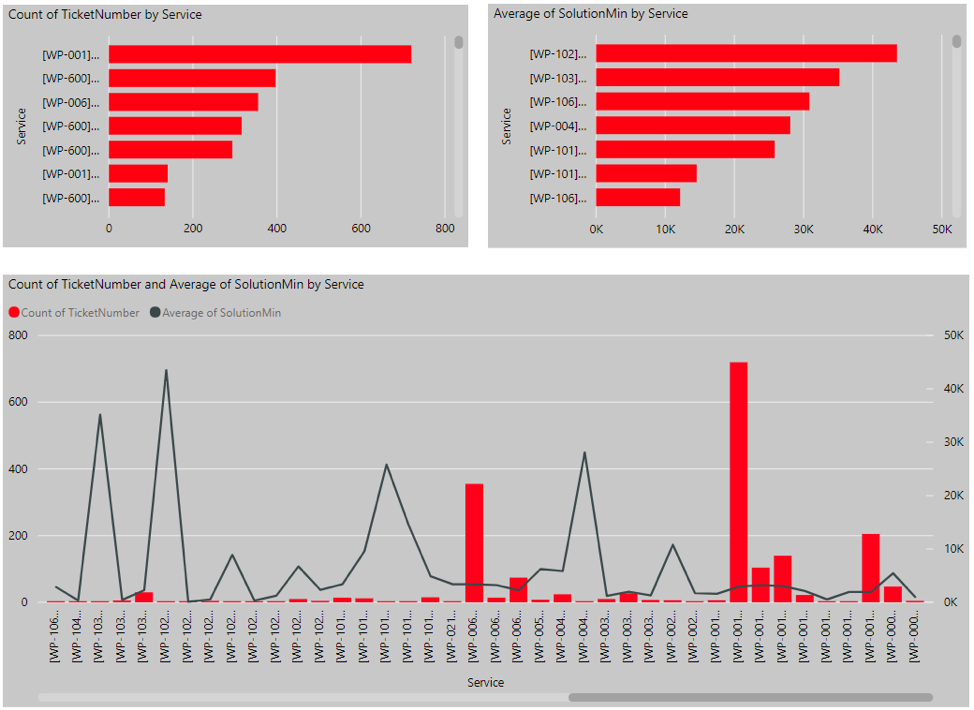
- What are the most requested services by ticket?
- Which services have higher ticket resolution times?
But most of all:
- Is there a correlation between the number of opened tickets for a given service and the average time it takes to resolve them?
The answer may not be obvious, and careful analysis of this data can be an excellent savings strategy.
To answer the previous questions, EriZone already offers two tables:
- eri_ticketaggregatedtime
- eri_ticketaggregatedtimeonline
The first contains closed tickets, while the second contains open tickets. And both reports together contain fundamental information concerning the progress of requests on EriZone.
Beyond the standard values, the tables include a lot of other helpful data including the counts of the processing time that takes into account both the working time and the suspension times of the tickets.
Extracting this data from EriZone and graphing it is very simple using the Microsoft Power BI Desktop solution, which is a free and complementary Power BI application.
After downloading Power Bi Desktop and installing the plugin for connecting it to MySQL, we are ready to connect to the two EriZone tables mentioned above.
In a few clicks we can get a graphical representation that answers our questions and analyzes the performance of services.
The advanced features of Power BI Desktop allow you to get other representations starting directly from the tables of EriZone.
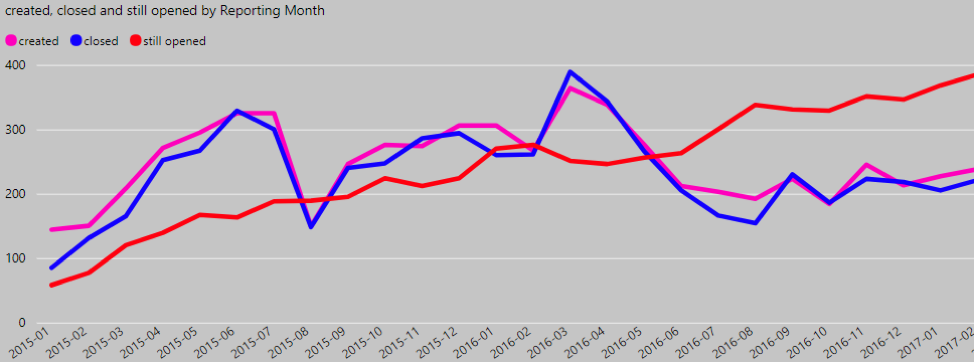
By adding a few lines of code you can calculate values that allow us to show, for example, the total number of tickets opened in a given period in order to monitor their progress.
In conclusion, why does ticket data have to be well represented and monitored?
Because only in this way will we obtain constant feedback through which we can guarantee a defined level of service.