
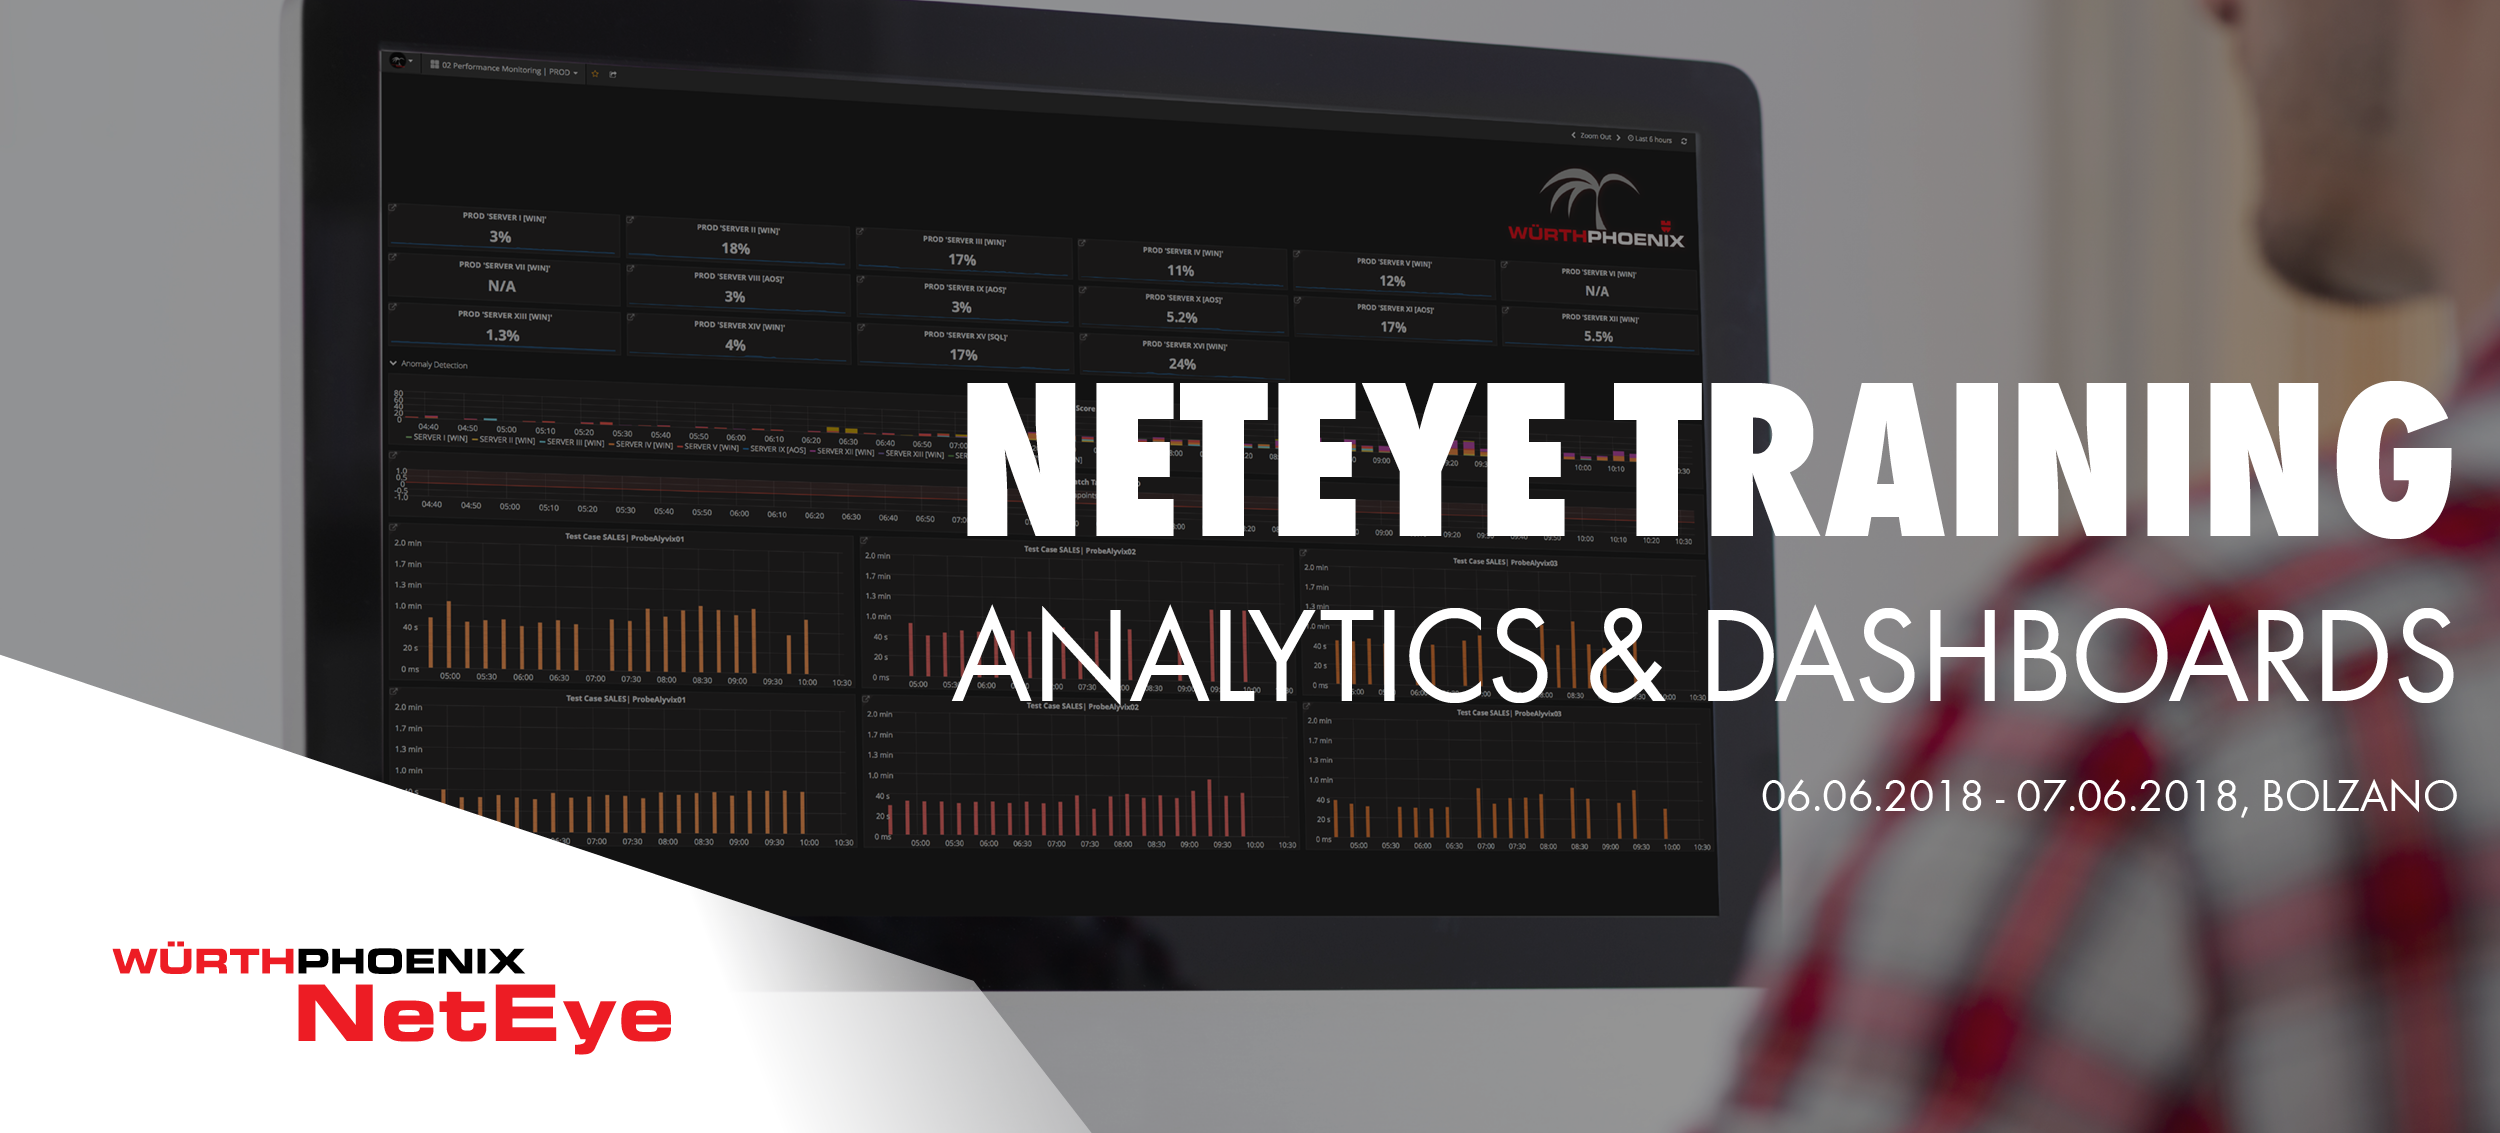
NetEye Analytics and Dashboards Training
The main objective for IT today is to guarantee high performance services and business continuity.
To achieve these goals, you need to combine at least three fundamental aspects: the right analytical capacity to measure each relevant metric both at the application and at the infrastructural level; timely notifications to intervene quickly and preemptively; and finally, a holistic and shared view that compares all the components through machine learning algorithms.
The NetEye Analytics & Dashboards solution precisely meets these prerequisites. Do not miss this opportunity to discover how you can identify problems proactively through the two days training.
Course Content
- General overview of the NetEye Analytics and Dashboards solution
- How to interpret and analyze performance graphs
- Comparison of continuous and discrete data
- Performance Monitoring: Understanding performance metrics and setting alarms
- User Experience: End-to-end monitoring and discrete event dashboards
- Grafana and InfluxDB: Influx query language and dashboards
- Machine Learning: Anomaly detection and risk estimation techniques
- Creation of test cases and exercises
Dates & Locations
- Wednesday, 06.06.2018 and Thursday, 07.06.2018
- Würth Phoenix Training Center, via Kravolg 4, 39100 Bolzano
- REGISTER NOW
About the trainer
 Susanne Greiner, Data Scientist, Würth Phoenix
Susanne Greiner is a passionate data scientist holding a Ph.D. in Information and Communications Technology (University of Trento, Italy) with a strong interest in machine learning and optimization. Coming from a background of experimental physics (University of Erlangen, Germany) and computational neuroscience, her special interests are visualization of and information extraction from multi-dimensional data by combining multiple data sources.
Her favorite programming language is Python, especially the scientific packages. In 2015 she decided to join the Research & Development Lab team of Würth Phoenix S.r.l. where she is currently concentrating on the improvement of performance monitoring strategies.


