16. 10. 2025
NetEye, Unified Monitoring

07. 03. 2019
Patrick Zambelli
Unified Monitoring
Monitoring Maps to Support Your IT Incident Management
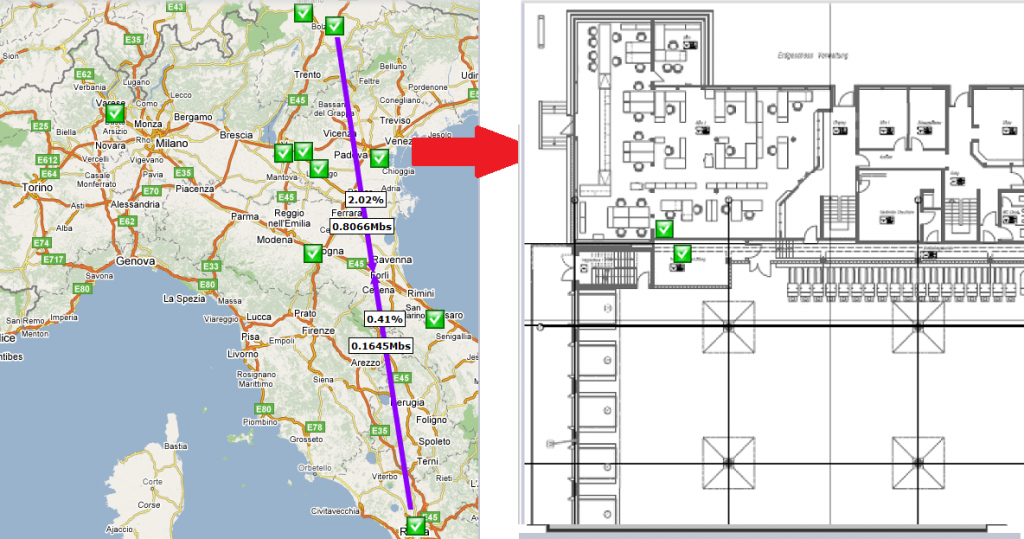
Within NetEye our users often make use of NagVis for creating static visualizations of monitored devices using geographical maps or floor plans. NagVis lets you create maps, including relations to other maps, and create navigation paths to highlight problems on a generic main map of your country or region. You can then use links to drill down into more detailed maps of your campus, building or floor plan. This works well since NagVis projects the worst state of any device or service from an underlying map onto the top-level map.
So far so good, as long as we are analyzing the worst state in maps and operating only within NagVis. The limitations arise when users treat the monitoring front-end as a central monitoring overview and then navigate into the various modules for advanced troubleshooting, e.g., Analytics Dashboards, NeDi or Asset Management. It is even more important when using a central problem view as a starting point to arrive at multiple points of information with minimal effort.
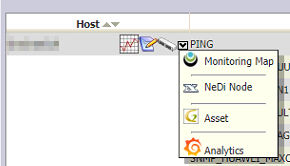
To enable this I took advantage of the possibilities to extend our
NetEye 3 Thruk monitoring frontend, creating action menu items. Here I’ve integrated a dynamic link into Asset Management or NeDi with minimal effort (The section “Setup and Configuration” below indicates the steps and the published resources providing the sample configuration).
Highlight Monitoring Maps for a Desired Host
One particular use case required me to extend the currently available logic: Information about devices’ locations had already been arranged on various floor plans. Those maps are used to guide a technician to a remote building to identify the various network devices or access points in case of an incident. Now I needed to link the “red” host or service from the monitoring view towards the map(s) where either this device or its related hostgroup is registered.
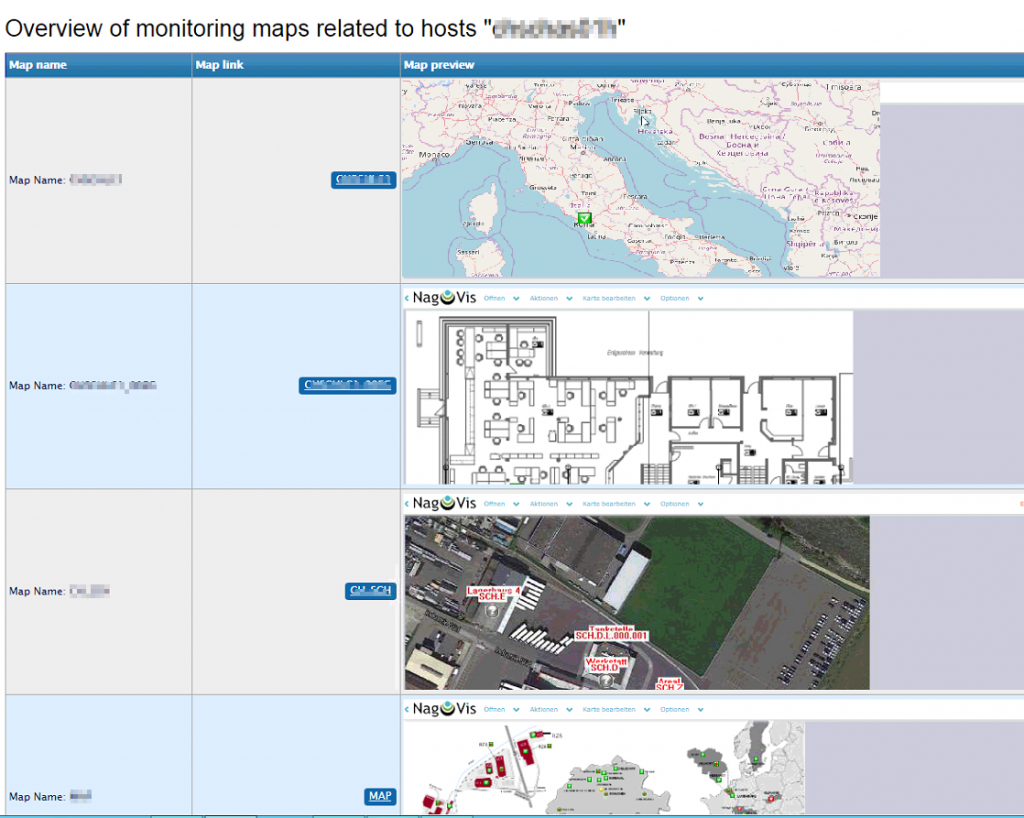
The solution consisted of the implementation of script logic that fetches all hostgroups a device is assigned to into a list, and searches within all NagVis maps for elements of either the host itself or one of the related hostgroups. The result is an overview page presenting the matches along with a small preview of the map and a link to easily reach this map.
to show matching NagVis maps.
Setup and Configuration
The how-to guide and script are published on my github repo, and you can easily integrate this feature within NetEye 3, along with any other installation that uses Thruk and NagVis:
https://github.com/zampat/neteye3/tree/master/thruk
- Back up or diff your original thruk_local.conf first
- Install the provided thruk_local.conf. This configuration sample provides the additional action links to the NagVis maps related to a host. In addition it provides also a link to the AssetManagement and Network Discovery module.
- Install the discovery script for monitoring maps. Default paths for NagVis and Livestatus are defined within a .cgi script. Adapt this if you port it to non-NetEye environments.
- Reload apache (service apache reload)
cp thruk_local.conf /var/lib/neteye/thruk/thruk_local.conf
cp monitoring2maps_link.cgi /usr/lib/nagios/cgi/monitoring2maps_link.cgi
service apache reload
Outlook for NetEye 4
Porting this feature to NetEye 4 might be done by substituting the Livestatus queries (which are event supported today by Icinga2) with native queries on the Icinga2 API (the preferred way to communicate with Icinga2).
Stay tuned for updates on the integration of NagVis Maps with NetEye4 / Icinga2 or comment on this blog to notify us a different usecase for this topic.

Patrick Zambelli
Project Manager at Würth IT Italy
After my graduation in Applied Computer Science at the Free University of Bolzano I decided to start my professional career outside the province. With a bit of good timing and good luck I went into the booming IT-Dept. of Geox in the shoe district of Montebelluna, where I realized how a big IT infrastructure has to grow and adapt to quickly changing requirements. During this experience I had also the nice possibility to travel the world, while setting up the various production and retail areas of this company. Arrived at Würth Phoenix (now Würth IT Italy) I started developing on our monitoring solution NetEye. Today, in my position as Consulting an Project Manager I am continuously heading to implement our solutions to meet the expectation of your enterprise customers.
Author
Latest posts by Patrick Zambelli
16. 01. 2024
NetEye, Unified Monitoring
Icinga 2 DSL for Defining the Monitoring Status of Objects with Director
23. 12. 2020
NetEye
Tornado – Getting in Action with Sample Rules
05. 05. 2020
NetEye, Unified Monitoring
Import Data Correlation and Automation with Icinga2 Director