Go pprof – How to Understand Where There is Memory Retention
Recently I had to face a problem concerning a daemon written in Go that was consuming all available memory – causing critical and unpredictable situations for all the other components of the system.
The first alarm came from NetEye: There was something that was requesting more and more memory.
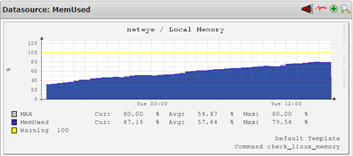
It was easy to understand which process it was: ‘top’ was quite clear. But why?
Go has a garbage collector that frees memory on the heap when it is no longer being referenced. In our case there was something that was forgetting to release the unused memory references, causing a memory retention – but what?
The Go pprof package allows you to enable sampled dumps of the heap, making the data available at a web-based endpoint over http. Once available, this dump can be analyzed to understand both the current allocated memory and the cumulative memory allocation.
The only thing you need to do is import net/http/pprof and start an http listener. The pprof package will register its endpoints right below the web server root at /debug/pprof.
import (
  "net/http"
  _ "net/http/pprof"
)
...
func main() {
  ...
  http.ListenAndServe("localhost:8080", nil)
}
After that you will be able to get heap data just by using a browser or curl, connecting via http://localhost:8080/debug/pprof/heap:
curl -s http://localhost:8080/debug/pprof/heap > /tmp/heap.outOnce you get data, you can analyze it using the pprof tool:
go tool pprof /tmp/heap.outor by connecting to the web server:
go tool pprof http://localhost:8080/debug/pprof/heap
In order to analyze the currently used memory, just select the inuse indices (bytes or object counts):
- inuse_space: memory allocated but not yet released
- inuse_objects: objects allocated but not yet released
If you are interested in understanding the total amount of bytes or objects, use the alloc indices instead:
- alloc_space: the total amount of memory allocated
- alloc_objects : the total number of objects allocated
Once I ran the pprof tool, it was easy to understand what exactly was happening with the daemon at fault.
go tool pprof --inuse_objects http://localhost:8080/debug/pprof/heap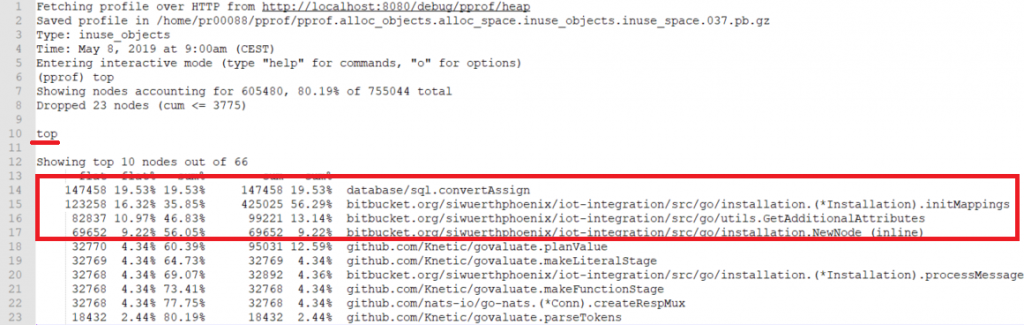
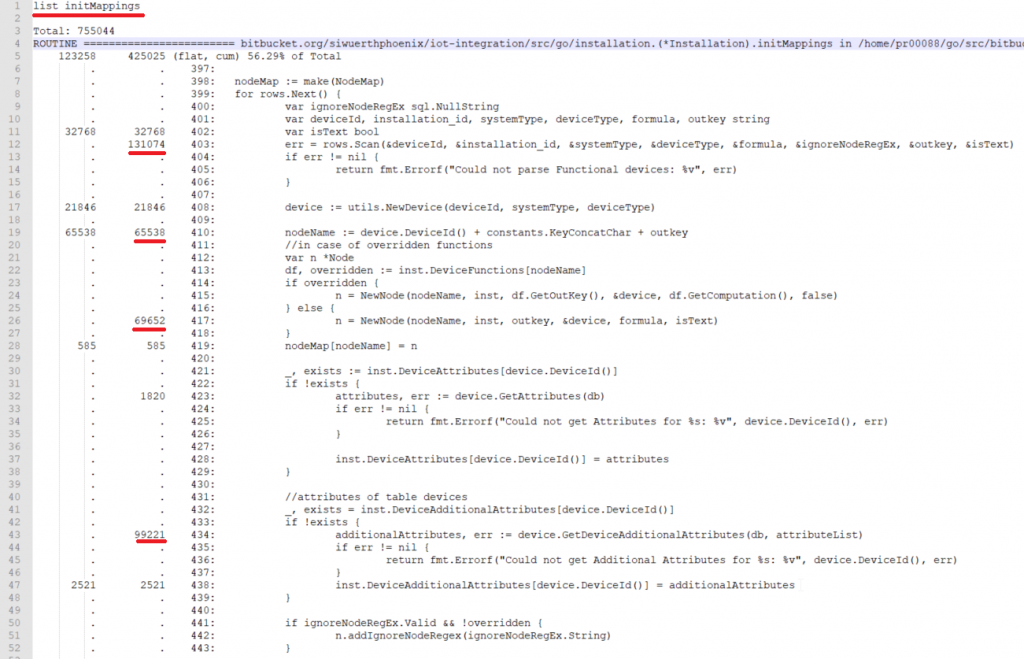
- flat: the memory allocated and held by this function
- cum: the memory allocated by this function together with functions that it has called
It is also possible to see additional details for memory used in functions called further down the stack: