


19. 09. 2025
NetEye

09. 08. 2019
Andrea Avancini
Log-SIEM, NetEye
Automatic Load Test of Rsyslog, Logstash, and Elasticsearch
At Würth Phoenix we take testing very seriously. NetEye 4 is a sophisticated product that operates in complex and business-critical environments, so it requires lots of tests before being released.
One challenging part of the testing phase is load testing, where the functionalities of a system are subject to predetermined levels of load. NetEye customers may need to constantly process and manage a huge amount (200GB) of logs per day with the NetEye SIEM module.
As you can imagine, this means that our logging pipeline composed of Rsyslog, Logstash, and Elasticsearch may need to face a constant but heavy load. The goal of a load test is to ensure that a NetEye installation can handle this volume of log data with minimal performance degradation.
Approach
To perform such a test, we need to:
- Configure the machine(s) that act as a log sender
- Configure NetEye as a log collector
- Generate and send a large number of logs per seconds on the log sender machine
- Extract performance metrics from NetEye and to put them in a database
- Restore everything they way it was before the test
All this must, of course, be automatic, repeatable as many times as possible, and having variable time duration. To meet these requirements, we implemented a tool that combines Ansible for the configuration part, and several Python scripts for log generation and metrics extraction.
At each test run, the following things happen:
- First, Ansible configures the log senders
- It installs any required RPM package at the system level
- It creates a virtual environment to install our log generator tool and its Python dependencies
- Next, it configures the log collector
- It sets up the log sender hosts in Icinga 2 Director and consequently in the Log Management module
- It manipulates the Logstash filters to add time-indexed metrics to the Elasticsearch documents
- It handles the required system services after these changes
- At this point, both log senders and collector are properly configured, so the former start to create and send logs to the latter at a fixed rate over a predetermined time window
- Finally, the logs are received by NetEye, written to disk by rsyslog, processed by Logstash and indexed by Elasticsearch
At the end of each test run, Ansible executes a Python script on the master machine that extracts performance metrics from Elasticsearch indices and forwards them to another NetEye 4 machine where they are stored in InfluxDB.
Experimental Framework
The cornerstones of the NetEye logging pipeline are rsyslog, Logstash, and Elasticsearch. Enabled hosts can send various types of logs to NetEye 4, where they are collected by rsyslog and written to disk. After being collected, logs are processed by Logstash (we ship different Logstash filter definitions and outputs according to the log type) and then indexed in Elasticsearch.
Questions: the goal of our load test is to understand the behavior of the NetEye log management pipeline in a single node configuration, under constant and heavy load. This load, however, can introduce potential performance degradation to the pipeline components, which must be avoided. The purpose of our investigation is to answer the following questions:
Q1: What is the behavior of the logging pipeline under heavy load?
Q2: Is there any performance overhead in the logging pipeline caused by the load?
Q3: If yes, what is that performance overhead caused by the load?
Q4: Which pipeline component suffers most in performance degradation, if there is any?
Metrics: Since the logging pipeline is composed of several elements like rsyslog, Logstash, and Elasticsearch, we tried to distinguish between metrics that are related to each of the components. More precisely, in order to answer the questions presented above, we calculated the following metrics:
- Log generation
- Number of sent logs
- Duration of the log generation phase (in seconds)
- Number of logs generated and sent per second
- Rsyslog
- Number of logs written
- Number of logs that went missing
- Percentage of logs that went missing
- Duration of the writing phase (in seconds)
- Number of logs written per second
- Logstash
- Number of logs ingested
- Duration of the ingestion phase (in seconds)
- Number of logs ingested per second
- Elasticsearch
- Number of indexed
- Average delay of ingestion (in seconds)
We use basic Python to extract the log generation metrics and to compute the rates and percentages.
Interaction with rsyslog, instead, is done by Ansible. To support the calculation of Logstash-related metrics, we automatically modify the Logstash filters on the log collector machine. This permits us to collect a richer set of information, such as the Logstash ingestion timestamp and the time delay between when rsyslog writes a log and Logstash finishes processing it, for each document indexed in Elasticsearch.
Finally, to interact with the Elasticsearch instance running on the log collector machine, we use the official Python Elasticsearch client, which allows us to run custom queries and extract the results.
Any test run of the framework generates a CSV file that contains all the metrics listed above. The same set of information is also written as a data point in InfluxDB, where it can be visualized in a custom dashboard and thus compared with other runs.
Experimental Procedure
As a preliminary test, we first shot a series of short bursts of logs (30 seconds of duration) against NetEye 4 to simulate brief peaks of load in the logging pipeline.
Then we defined different test scenarios for our main load test, as follows:
- 5000 logs per second, over a 1 hour period
- 7000 logs per second, over a 1 hour period
- 10000 logs per second, over a 1 hour period
We ran each scenario 5 times to collect the average for each metric while keeping the rsyslog, Logstash and Elasticsearch configurations just as those shipped as the defaults in NetEye.
We ran the tests on a laptop machine equipped with an Intel i7-8650U CPU@1.90GHz (8 cores) and 16 GB of memory, running Fedora 30 64-bit with Ansible 2.8.0 and Python 3.7.4. The log sender machines were NetEye 4-based virtual machines with 4 CPUs and 8GB of memory, running CentOS 7 with Python 2.7. The NetEye 4 log collector was a NetEye 4 Ebs server, equipped with 32 Intel Xeon CPUs E5-2660@2.20GHz and 64GB of RAM, running CentOS 7.
Preliminary Results
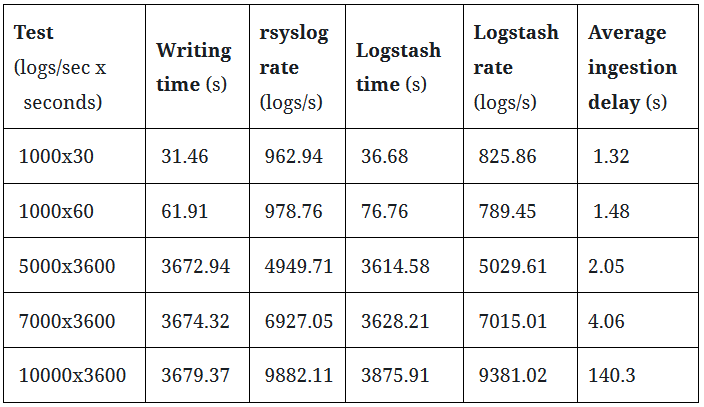
The preliminary results are shown in the two tables below.
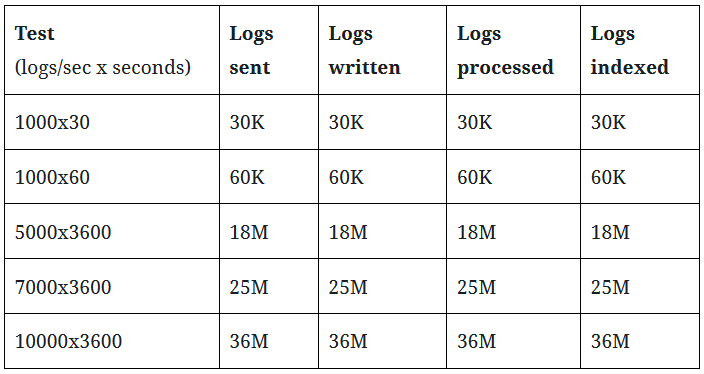
Overall, the pipeline is robust enough to process a constant but heavy load without losing any logs, as can be seen in the first Table. In each run, all logs transmitted by the log senders were received and written to disk by rsyslog, processed by Logstash, and indexed by Elasticsearch without losing any logs along the way.
In terms of performance, the pipeline components perform very well. We can see, however, that Logstash is being outpaced by rsyslog when sending more than 7000 events per second, as the average ingestion delay becomes larger than 2 minutes. This was somewhat expected since we used baseline hardware and software configurations for the tests (single server, default software configuration). Should you need to handle more than 7000 events per second over long time spans, our advice is to contact our experts to find the right solution to satisfy your requirements.
We can say, in conclusion, that the NetEye 4 logging pipeline is robust and works quite well under heavy load.
Andrea Avancini
DevOps Engineer at Würth Phoenix
Loving understanding of how things work, how things can be automated, and how to apply new technologies when needed. Passionate about technology, open-source software, and security. I found Würth Phoenix the right place for this.
In the past, I co-founded a cybersecurity startup that produces security solutions for mobile apps and blockchain.
Previously, I worked as researcher at Fondazione Bruno Kessler of Trento. My research was mainly focused on web and mobile app security and testing.
I got my PhD in Computer Science at the University of Trento.
Author
Latest posts by Andrea Avancini
18. 10. 2021
NetEye
New Feature for NetEye 4.20
01. 10. 2021
Business Service Monitoring, NetEye
Hosts and NetEye Upgrade