
22. 03. 2022
Tobias Goller
Icinga Web 2, Machine Learning, NetEye
Performance Metrics Collection from NetEye to Elastic
Today my objective is to collect the performance metrics from various NetEye Icinga checks and write them out to Elasticsearch so I can apply Machine Learning (ML) algorithms to identify potential anomalies. This is a task that’s not possible with the open-source version of InfluxDB installed in NetEye. Moreover, this data in Elastic is used to create dashboards by employees and external consultants.
The idea for the following implementation design came from my colleague Mirko Bez.
To read the data from Icinga 2, we use the Tornado Icinga Collector. This collector in turn uses Icinga Event Streams (https://icinga.com/docs/icinga-2/latest/doc/12-icinga2-api/#event-streams) to receive Events from Icinga with a Subscribe/Notify approach. This functionality is provided by the Tornado Icinga Collector, which is installed by default.
To configure our stream we create the file /neteye/shared/tornado_icinga2_collector/conf/streams/001_PerfData.json that contains the relevant settings to read the CheckResults for the services (independently from the host!): NRPE_Win_CPU, NRPE_Win_Diskspace, NRPE_Win_Memory, NRPE_Linux_Diskspace, NRPE_Linux_Load, NRPE_Linux_Memory, and NRPE_Linux_Swap.
The following is a example configuration:
cat /neteye/shared/tornado_icinga2_collector/conf/streams/001_PerfData.json
{
  "stream": {
    "types": ["CheckResult"],
    "queue": "icinga2_basic_events",
    "filter": "event.service in [\"NRPE_Win_CPU\", \"NRPE_Win_Diskspace\", \"NRPE_Win_Memory\", \"NRPE_Linux_Diskspace\", \"NRPE_Linux_Load\", \"NRPE_Linux_Memory\", \"NRPE_Linux_Swap\" ]"
  },
  "collector_config": {
    "event_type": "icinga2_perfdata",
    "payload": {
      "@timestamp": "${timestamp}",
      "icinga": {
         "service": "${service}",
         "check_source": "${check_result.check_source}"
      },
      "metrics": "${check_result.performance_data}",
      "host": {
         "name": "${host}"
      }
     }
  }
}
The Tornado Icinga Collector sends the data to Tornado (through nats-server).
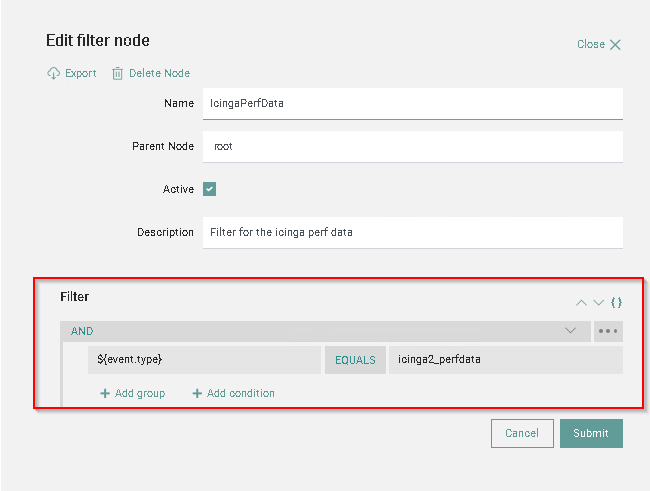
Within Tornado we create a filter named IcingaPerfData that filters only the events of type icinga2_perfdata, i.e., the data coming from the 001_PerfData stream.
Tornado then sends the data to Elasticsearch in the index tornado.
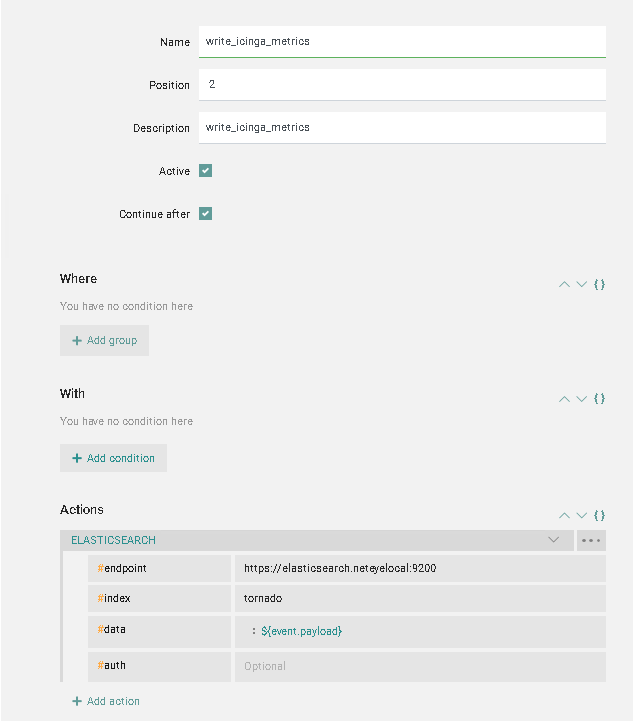
The index tornado has a default pipeline that parses the metrics and dispatches the documents to the correct data_streams: Either metrics-icinga.linux-default or metrics-icinga.windows-default according to the platform of the check. This means that the Tornado Index always remains empty.
The user Tornado has the necessary rights to write the data into the metrics* indices because a role mapping tornado_icinga_metrics adds to the Tornado user the custom role icinga-metrics-writer.
Finally, with the performance data now in Elastic you can start to create dashboards and machine learning jobs.
These Solutions are Engineered by Humans
Are you passionate about performance metrics or other modern IT challenges? Do you have the experience to drive solutions like the one above? Our customers often present us with problems that need customized solutions. In fact, we’re currently hiring for roles just like this and others here at Würth Phoenix.


Tobias Goller
NetEye Solution Architect at Würth IT Italy
I started my professional career as a system administrator.
Over the years, my area of responsibility changed from administrative work to the architectural planning of systems.
During my activities at Würth IT Italy, the focus of my area of responsibility changed to the installation and consulting of the IT system management solution WÜRTHPHOENIX NetEye.
In the meantime, I take care of the implementation and planning of customer projects in the area of our unified monitoring solution.
Author
Latest posts by Tobias Goller
16. 02. 2026
Unified Monitoring
OpenShift Monitoring in NetEye
13. 10. 2025
Log-SIEM, Unified Monitoring
Elastic Defend: Experiences
18. 07. 2025
Automation, Cloud
Running SOS Berlin JobScheduler in Containers: A Step Toward Cloud-Native Scheduling
16. 04. 2025
NetEye, Unified Monitoring
Application Performance Monitoring in NetEye with Elastic APM and OpenTelemetry