28. 08. 2024
Unified Monitoring

After my last ntopng trainings, which I taught as an instructor, I noticed that many ntopng users were not familiar with the display of multiple time series charts overlapping in one graphic.
Since I believe that this is one of the most important display options, I’ll use this blog post to show you how to configure something like this in ntopng version 5.6.
Use case description:
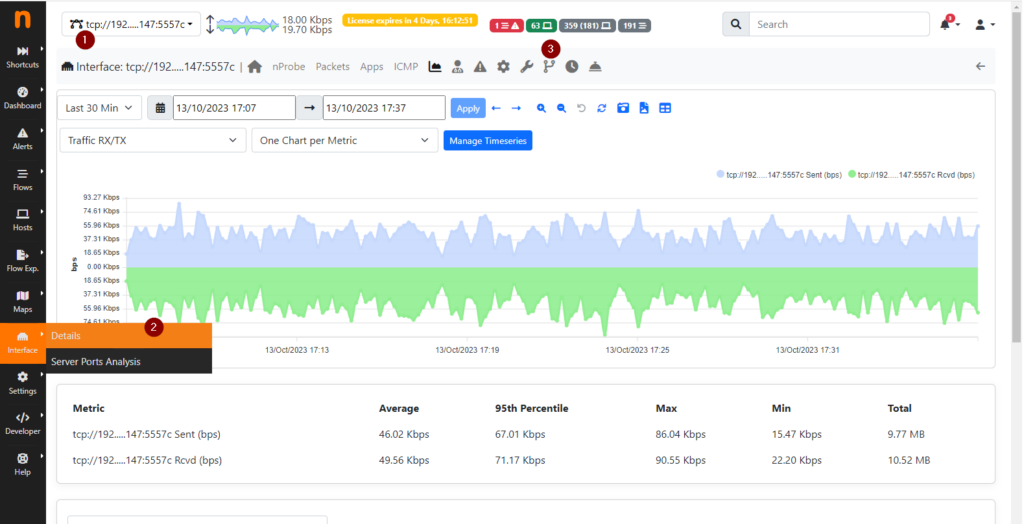
I’m monitoring an interface in ntopng that receives the flows on port 5557, and I want to know how much of the traffic goes to HTTP and HTTPS traffic.
Part 1
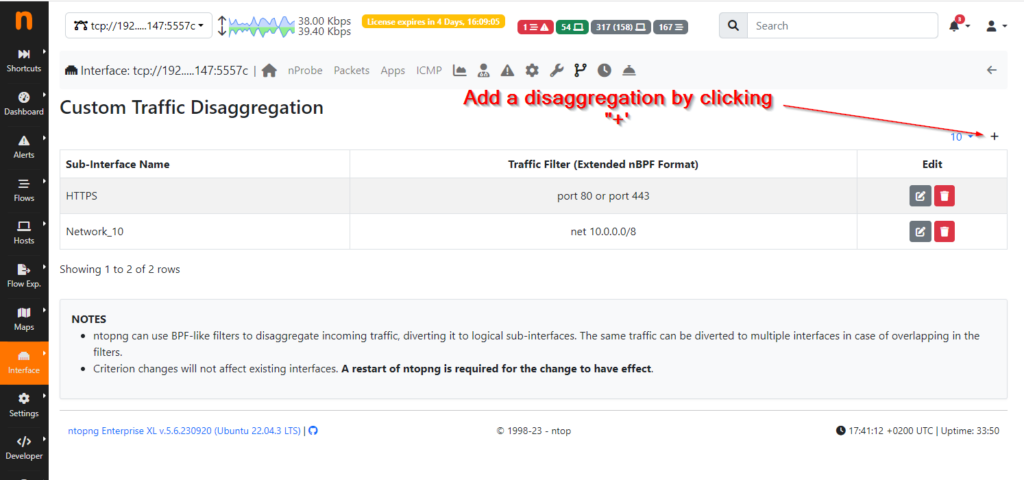
Using the “Custom Traffic Disaggregation” functionality, I create a subinterface with the filter for HTTP and HTTPS. This subinterface only shows me the filtered flows:
Click on the “+” button to add the disaggregation.
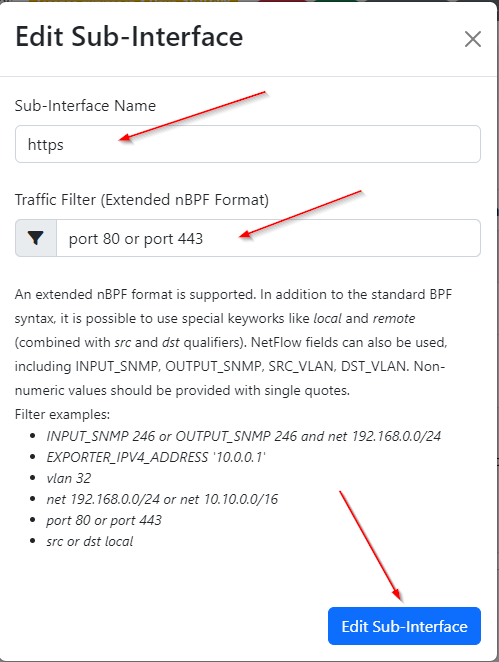
Create the desired filter:
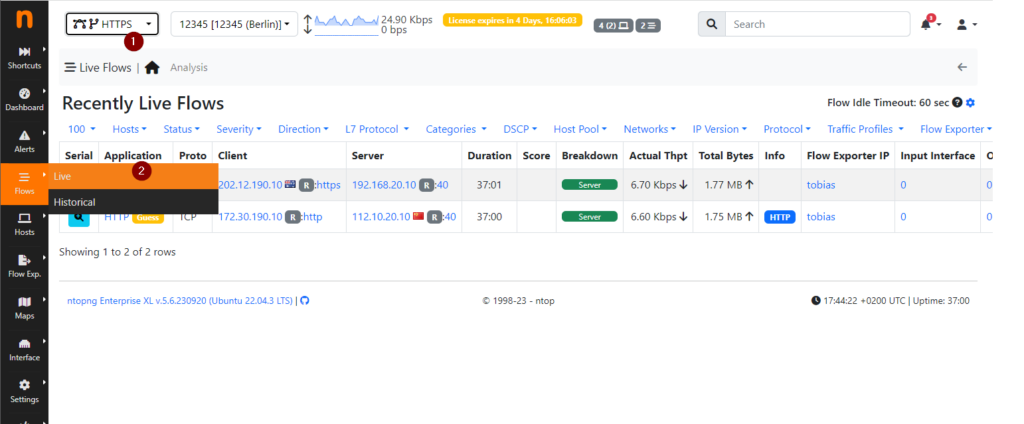
When you finish creating the filter, verify that the flows are correctly filtered by selecting the new subinterface on point “1”:
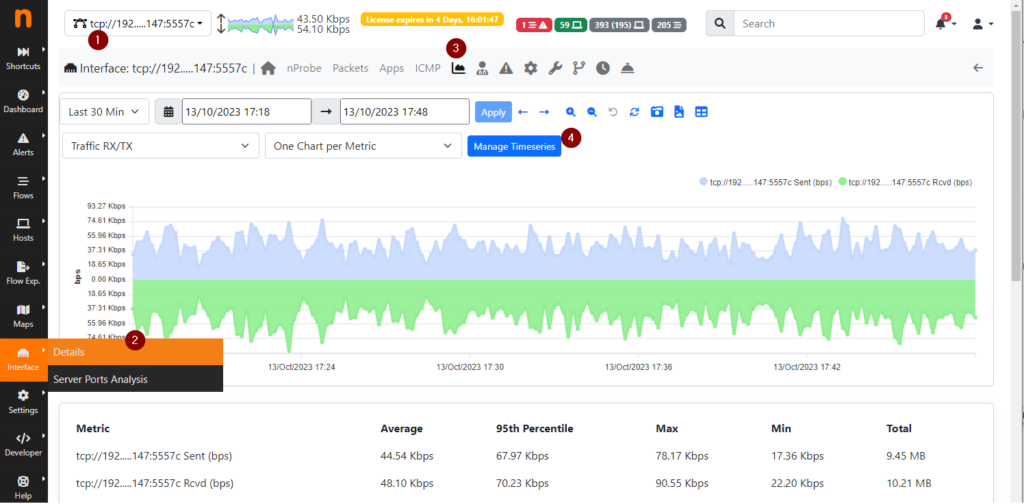
If everything works fine, go back to the original interface on port 5557, verify point “1” on the image and open the graphic and “Manage Timeseries” window:
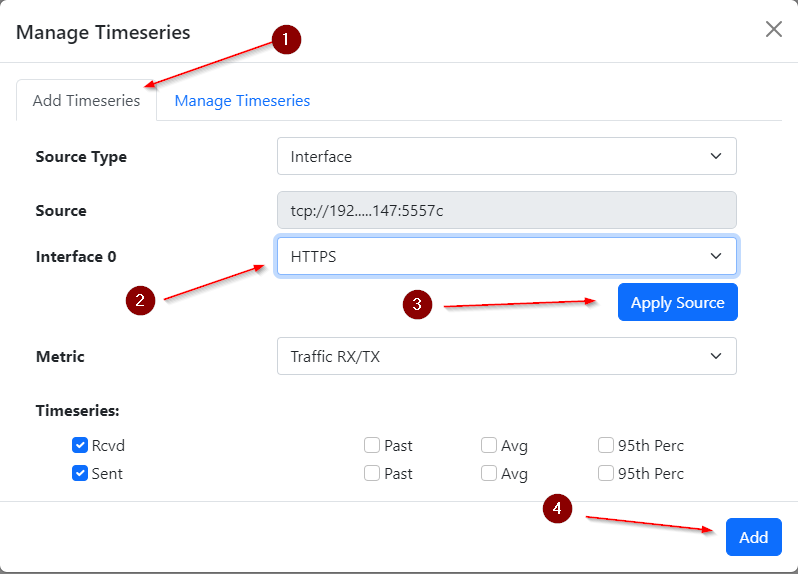
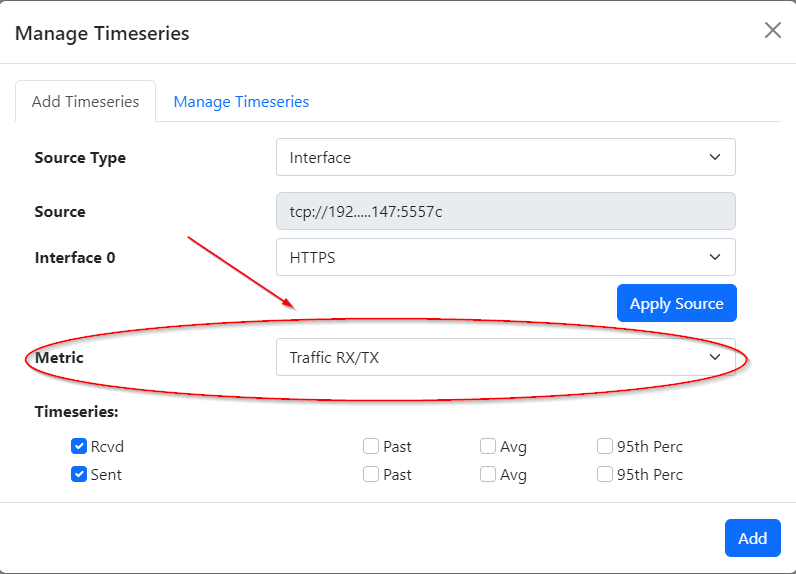
On the “Manage Timeseries” windows create your additional time series; in our case select the newly created subinterface:
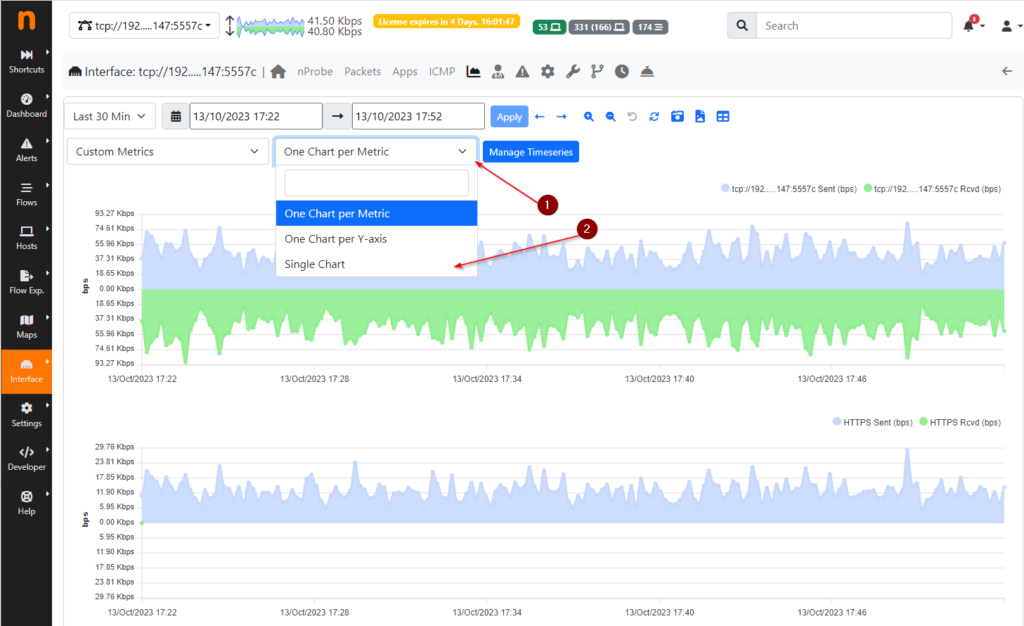
Afterwards you’ll see both charts, but separated out. To lay over the newly created subinterface, follow the instructions:
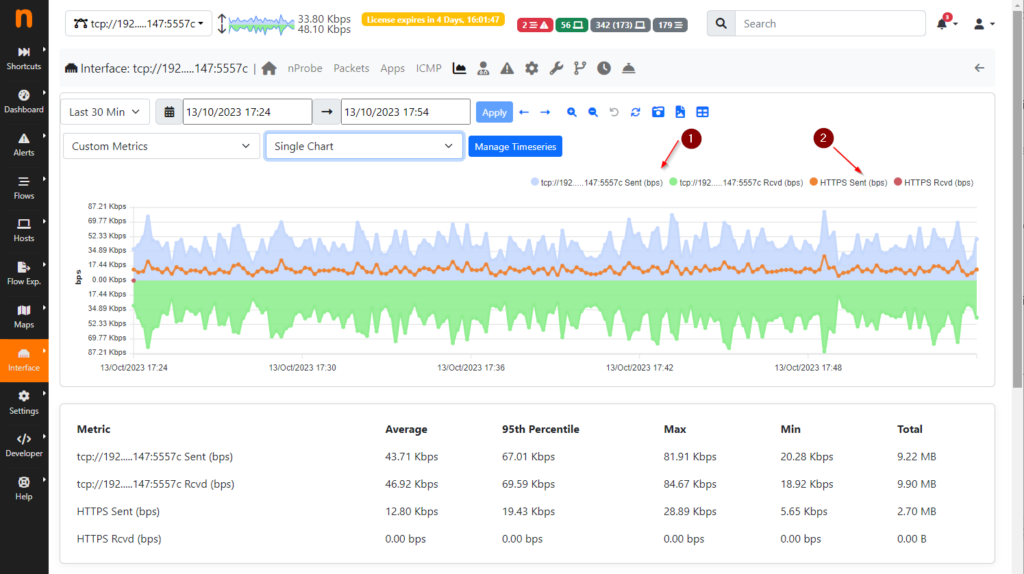
Next you’re able to see all the traffic, and via the orange line the HTTP/HTTPS traffic.
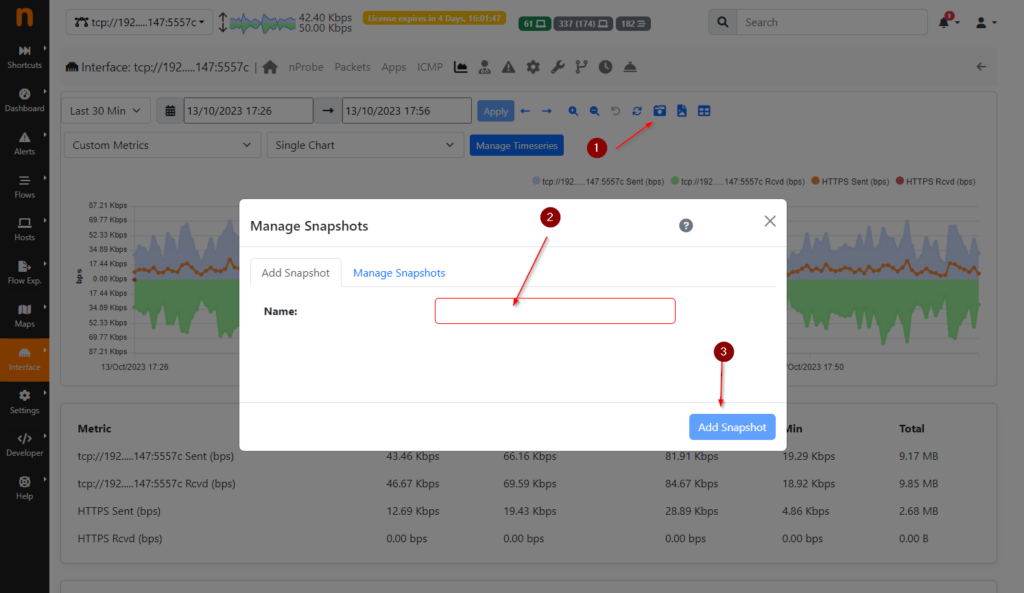
Finally you can create a snapshot of this graphic. By creating a snapshot, you can save the graphic settings and easily reopen them at another time.
Part 2
I place the subinterface I just created called HTTPS on the graphic with the complete traffic, and see how much the HTTPS traffic makes up the total traffic.
Of course, when selecting the time series, you can also select other predefined filter options for the metrics under the “Metric” item.
This example is intended to demonstrate the possibility of analyzing various network flows and identifying bottlenecks.
These Solutions are Engineered by Humans
Did you find this article interesting? Does it match your skill set? Our customers often present us with problems that need customized solutions. In fact, we’re currently hiring for roles just like this and others here at Würth Phoenix.

Tobias Goller
NetEye Solution Architect at Würth IT Italy
I started my professional career as a system administrator.
Over the years, my area of responsibility changed from administrative work to the architectural planning of systems.
During my activities at Würth IT Italy, the focus of my area of responsibility changed to the installation and consulting of the IT system management solution WÜRTHPHOENIX NetEye.
In the meantime, I take care of the implementation and planning of customer projects in the area of our unified monitoring solution.
Author
Latest posts by Tobias Goller
16. 02. 2026
Unified Monitoring
OpenShift Monitoring in NetEye
13. 10. 2025
Log-SIEM, Unified Monitoring
Elastic Defend: Experiences
18. 07. 2025
Automation, Cloud
Running SOS Berlin JobScheduler in Containers: A Step Toward Cloud-Native Scheduling
16. 04. 2025
NetEye, Unified Monitoring
Application Performance Monitoring in NetEye with Elastic APM and OpenTelemetry