
21. 10. 2022
Giuseppe Di Garbo
Icinga Web 2, ITOA, NetEye
A Custom Dashboard for Windows and Linux Servers
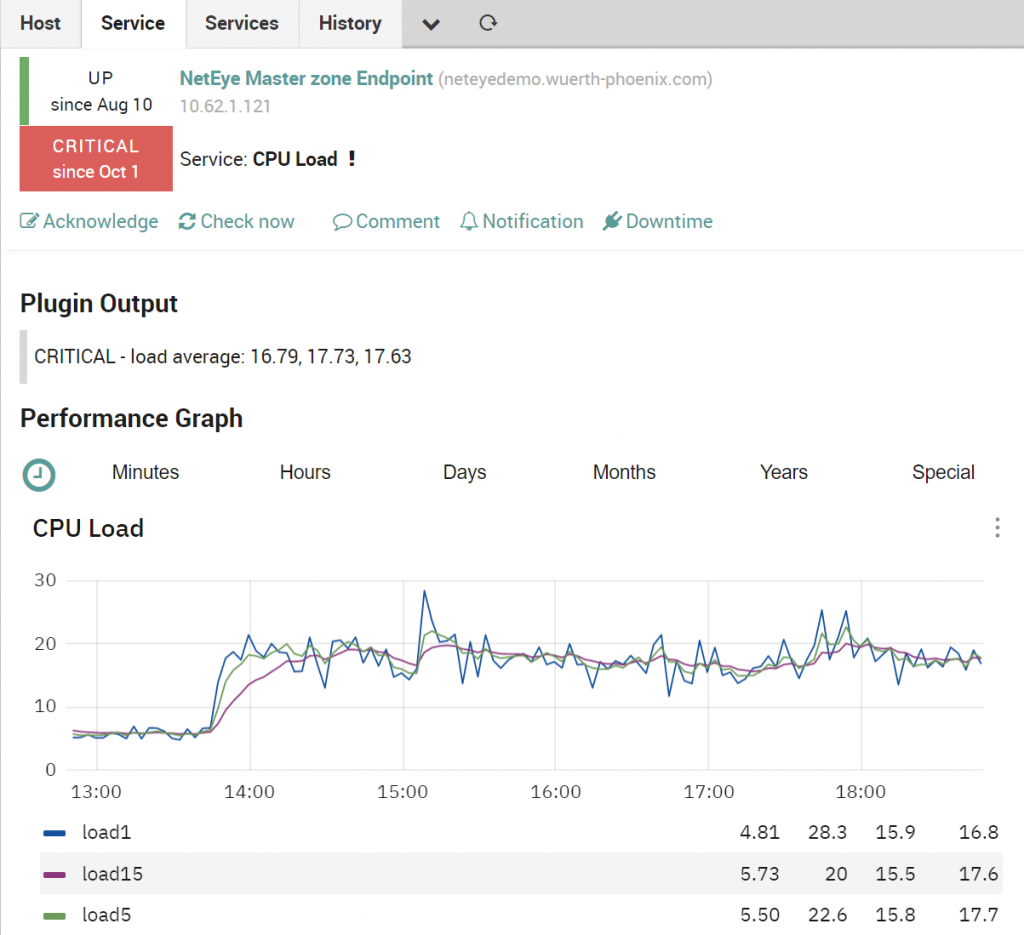
The performance graphs present in NetEye are very useful for getting an immediate idea of the trend related to a service check, but they’re still limited to the metric being viewed.
Also, the “Show all graphs” option available from the Actions menu of each monitored Host can have different usage limits due to the presence of many service checks with performance graphs.
With the ITOA module and with some features of the NetEye web interface we can do much more.
In this blog post we’ll see how to display a custom dashboard for a limited family of hosts (Windows and Linux servers).
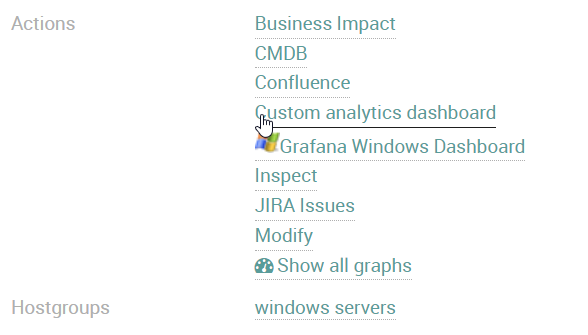
Have you ever tried Host and Service actions?
Host and Service actions are a rarely used feature, but they’ve got great potential. They can be managed by any NetEye user via the account settings and Navigation Items menu, and can help to extend NetEye functionality by contacting a URL (for example a wiki, a CRM or the NetEye ITOA module) which can be passed as a parameter a macro ($host.name$, $host.address$, …) and/or a custom property of the host or service check in use.
In the following example available in our online demo you’ll find several applications of extended Actions.
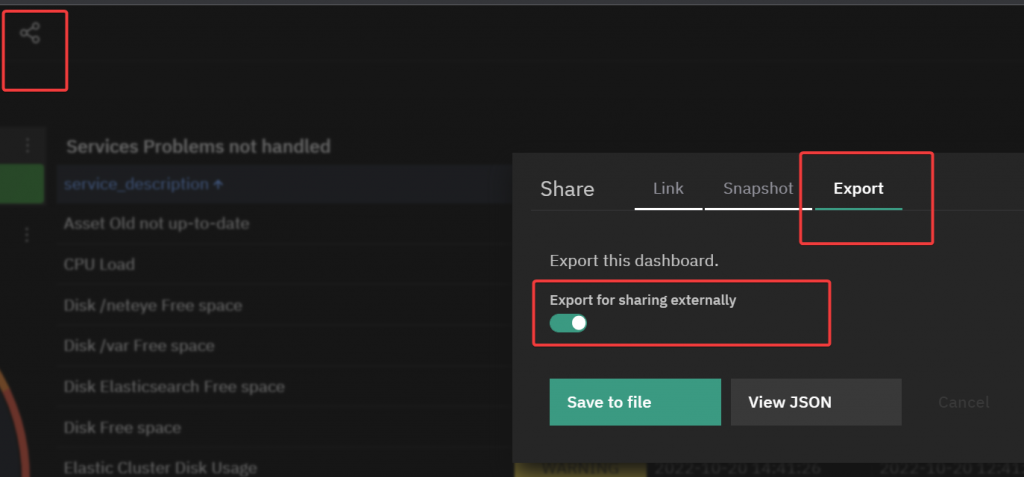
First of all you have to export and then import the two example Dashboards from our demo system to your NetEye Master node from the following URLs:
Remember to export them with the option “Export for sharing externally”.
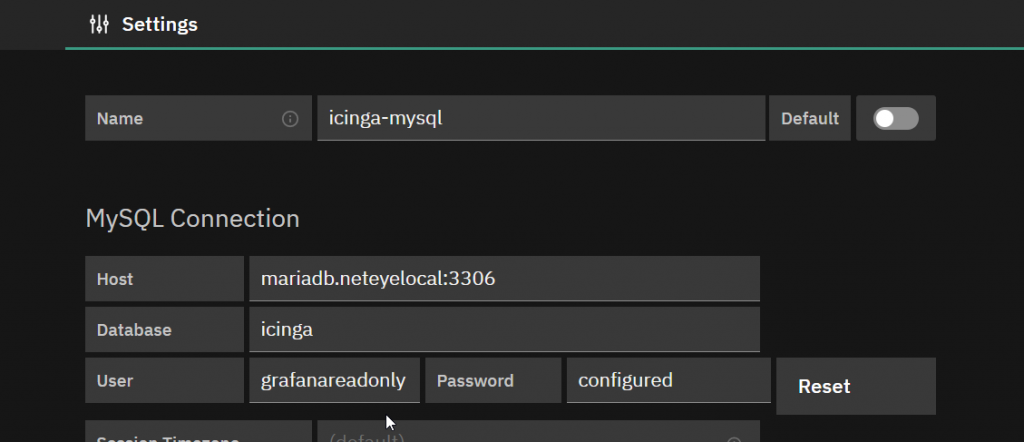
You also need a MYSQL datasource with a user that has read rights on the Icinga database, as shown in the following example:
After importing each dashboard you should get a dropdown menu showing Linux and Windows hosts respectively.
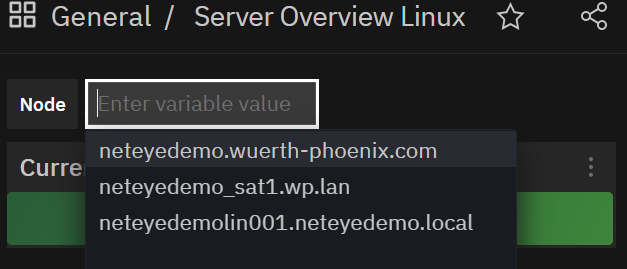
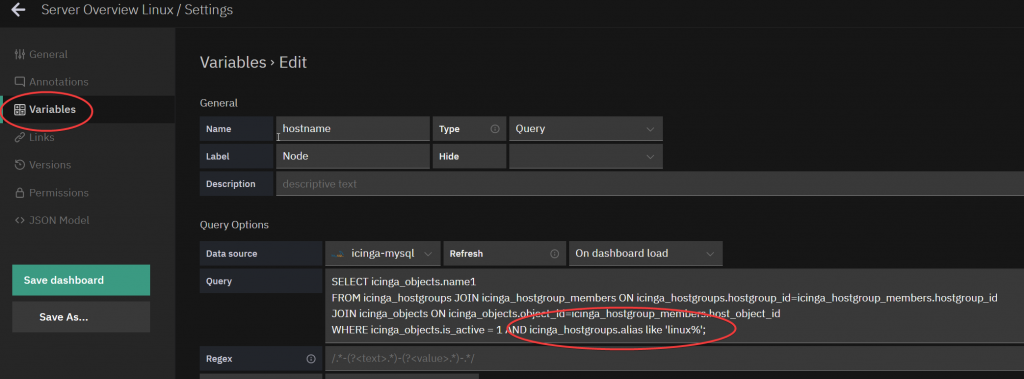
If not, you need to adjust the query of the variable hostname from “Dashboard Settings – Variables” and adjust the hostgroup name.
Finally, take a note of the URL of each dashboard starting from “analytics”. In our demo system these are:
- Linux: analytics/show?src=%2Fneteye%2Fanalytics%2Fgrafana%2Fd%2FLy-IaVI4z%2Fserver-overview-linux%3ForgId%3D3%26
- Windows: analytics/show?src=%2Fneteye%2Fanalytics%2Fgrafana%2Fd%2FNt1UMO4Vz%2Fserver-overview-windows%3ForgId%3D3
Now let’s create two Host actions that will allow us to open a custom Dashboard for all Windows hosts of the hostgroup “windows_servers”, and a different one for Linux hosts of the hostgroup “linux_servers”.
From our user’s account setting we need to select Navigation and then “Create a New Navigation Item”, choosing Host Action:
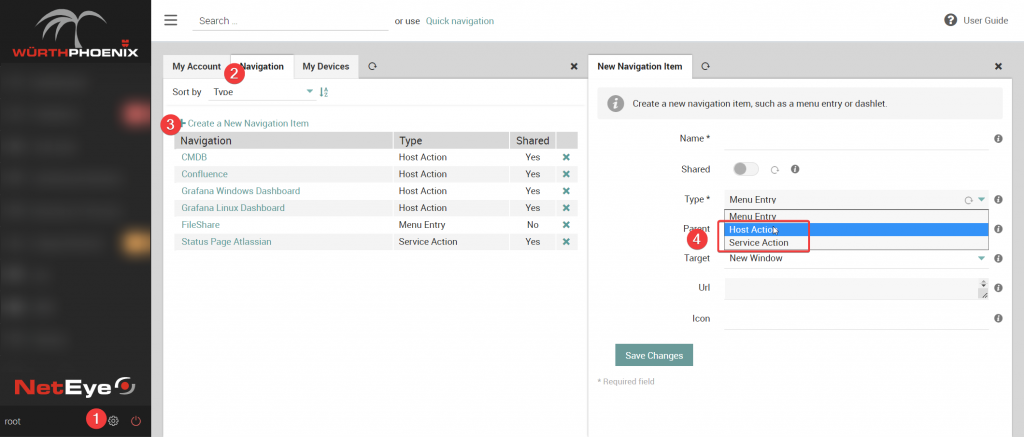
Later we’ll have to create two different Navigation Items: once for Windows servers and once for Linux Servers as follows.
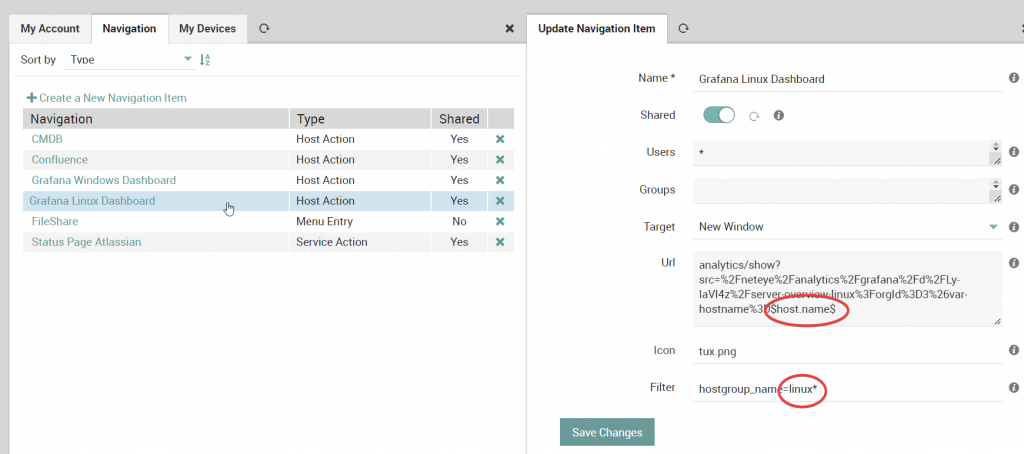
For each Navigation Item you can define the following options:
- Name: the name of the Navigation Item showed in the Actions section of the host/service
- Shared: to share the Navigation Item with other users
- Users: list of users to share the Navigation Item with (* for all)
- Groups: list of groups to share the Navigation Item with (* for all)
- Target: The target on which to open the Navigation Item URL
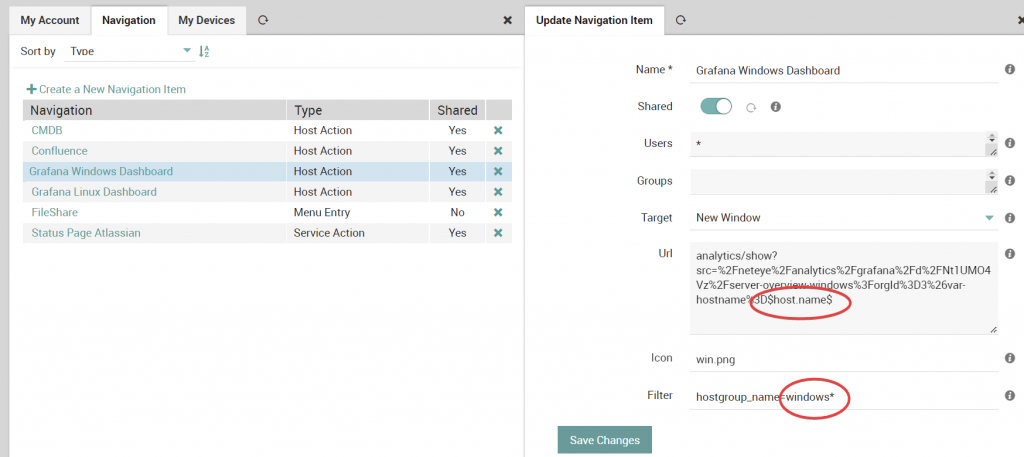
- Url: the URL of the Navigation Item (where it’s possible to include macros and custom properties as in the following examples)
- Windows URL: analytics/show?src=%2Fneteye%2Fanalytics%2Fgrafana%2Fd%2FNt1UMO4Vz%2Fserver-overview-windows%3ForgId%3D3%26var-hostname%3D$host.name$
- Linux URL: analytics/show?src=%2Fneteye%2Fanalytics%2Fgrafana%2Fd%2FLy-IaVI4z%2Fserver-overview-linux%3ForgId%3D3%26var-hostname%3D$host.name$
- Icon: the icon of the Navigation Item
- Filter: to display the Action only for those objects matching this filter
- In our examples, the filter is used to filter only Windows and Linux server hostgroups.
Grafana Window Dashboard Navigation item
Grafana Linux Dashboard Navigation item
Conclusions
At the end we should have the “Grafana Linux Dashboard” and “Grafana Windows Dashboard” Host Actions respectively for each host in the respective hostgroups, allowing you to open the dashboard with the metrics related to the selected host.
These Solutions are Engineered by Humans
Did you find this article interesting? Does it match your skill set? Our customers often present us with problems that need customized solutions. In fact, we’re currently hiring for roles just like this and others here at Würth Phoenix.


Giuseppe Di Garbo
Consultant at Würth IT Italy
Hi everybody. I’m Giuseppe and I was born in Milan in 1979. Since the early years of university, I was attracted by the Open Source world and operating system GNU\Linux. After graduation I had the opportunity to participate in a project of a startup for the realization of an Internet Service Provider. Before joining Würth Phoenix (now Würth IT Italy) as SI consultant, I gained great experience as an IT consultant on projects related to business continuity and implementation of open source software compliant to ITIL processes of incident, change and service catalog management. My free time is completely dedicated to my wife and, as soon as possible, run away from Milan and his caotic time and trekking discover our beautiful mountain near Lecco for relax and lookup the (clean) sky.
Author
Latest posts by Giuseppe Di Garbo
19. 12. 2025
Atlassian, Service Management
Jira Service Management Customer Detail Fields: A Practical Use Case
29. 09. 2025
Atlassian, Service Management
Streamlining Service Request Management with ITIL4 and Jira Service Management
30. 06. 2025
Atlassian, Service Management
Creating Jira Service Management Requests from a Public Website? Here’s the Secure, No-API Way
28. 03. 2025
Atlassian, Service Management
Effortless On-Call Management with Jira Service Management
20. 12. 2024
Atlassian, NetEye, Service Management
Managing Alerts with JSM: Focus on Incident Management (Part 2)