


28. 08. 2024
Unified Monitoring

At the end of June, Luca Deri gave a webinar presenting the new features of the next ntopng release. I’d like to take this opportunity now to present these innovations to all of you.
The main enhancements of the new release have been made in the following areas:
- Extension of the ntopng functionalities for the monitoring of OT/Scada systems
- Aggregated flows
- Zoom and MS Teams monitoring
- Inactive monitoring
- New GUI: Tables and charts
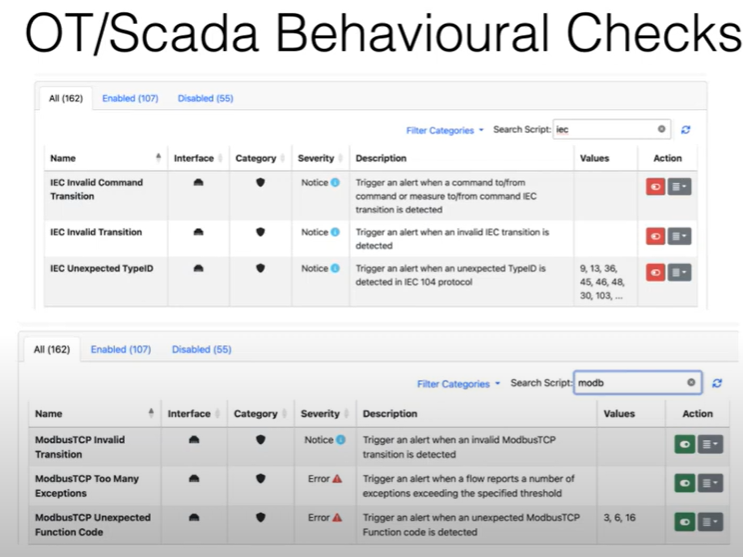
Extension of the ntopng functionalities for the monitoring of OT/Scada systems
With the new ntopng release, ntopng is able to detect, report and alert:
- Unusual error messages
- Unsupported function calls
- Function calls that have not been used before
- Unknown function codes
- Abnormal protocol behavior
- Unexpected state transitions
- Values outside of defined ranges
- Changes in frequency / periodicity
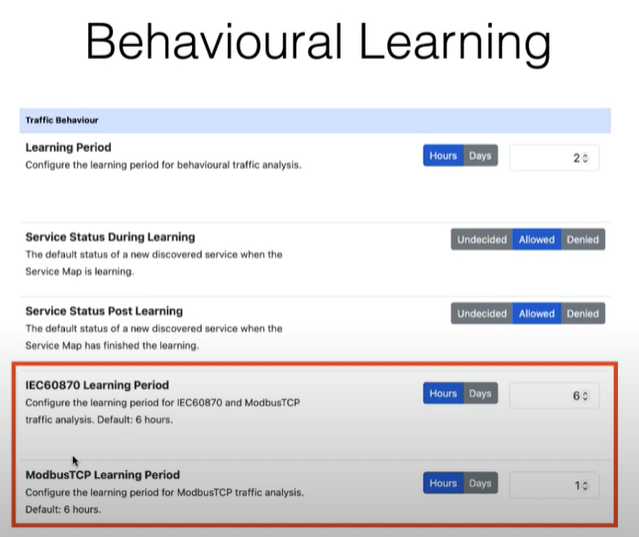
Various Modbus alarms can be activated as behavioral checks:
To enable the detection of abnormal behavior, the following parameters must be configured in the settings in the Behavioural Learning area:
Aggregated flows
The historical flows are already stored in a Clickhouse database. Over time, this historical data can become very large. If you want to look at data older than a week, for example, you may no longer need such precise granularity.
Thus ntopng now includes the possibility of storing flows aggregated according to criteria you can set yourself. This also depends on alerts.
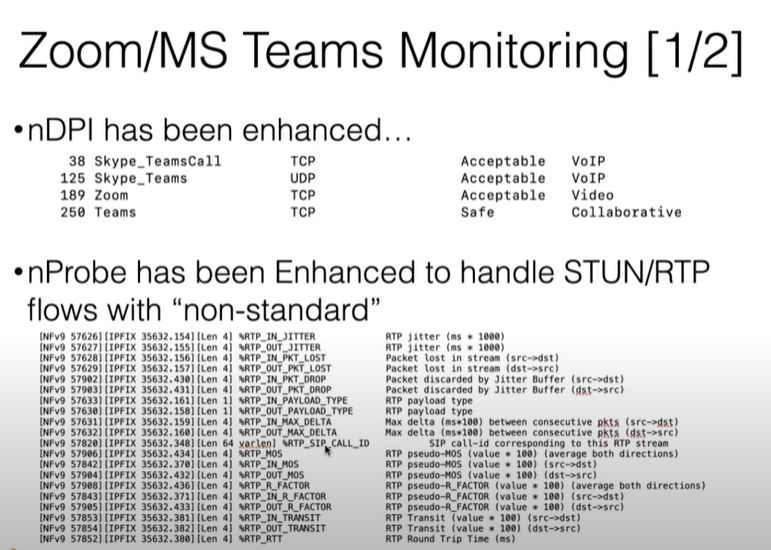
Zoom and MS Teams monitoring
There are always difficulties in using MS Teams. Thus, a request was made to ntop to improve the monitoring of Zoom and MS Teams connections.
For this reason, nDPI and nProbe have been extended accordingly:
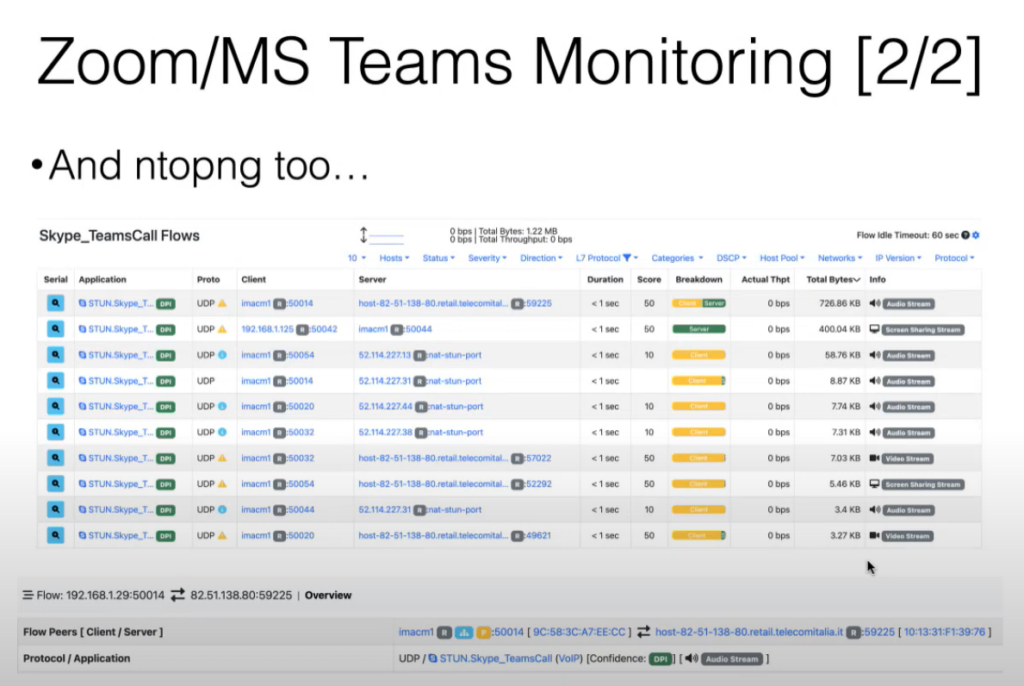
With these extensions, ntopng can now display the individual flows even better. The following screenshot from the new release shows how ntopng can display the flows in even more detail. Please note the info column, in which further personalization of the flows can be made.
Inactive monitoring
With the new ntopng release it will be the first time that ntopng shows hosts which are no longer active.
In the standard host overview you now will see which hosts are currently active and which are no longer active.
New GUI: Tables and charts
The main implementation change here was the presentation of graphical charts. Since performance problems constantly arose when using the graphic charts, it became necessary to rely on a new technology.
Therefore, new libraries for the graphic chart representations were implemented, resulting in significant performance improvements.
These Solutions are Engineered by Humans
Did you read this article because you’re knowledgeable about networking? Do you have the skills necessary to manage networks? We’re currently hiring for roles like this as well as other roles here at Würth Phoenix.

Tobias Goller
NetEye Solution Architect at Würth IT Italy
I started my professional career as a system administrator.
Over the years, my area of responsibility changed from administrative work to the architectural planning of systems.
During my activities at Würth IT Italy, the focus of my area of responsibility changed to the installation and consulting of the IT system management solution WÜRTHPHOENIX NetEye.
In the meantime, I take care of the implementation and planning of customer projects in the area of our unified monitoring solution.
Author
Latest posts by Tobias Goller
16. 02. 2026
Unified Monitoring
OpenShift Monitoring in NetEye
13. 10. 2025
Log-SIEM, Unified Monitoring
Elastic Defend: Experiences
18. 07. 2025
Automation, Cloud
Running SOS Berlin JobScheduler in Containers: A Step Toward Cloud-Native Scheduling
16. 04. 2025
NetEye, Unified Monitoring
Application Performance Monitoring in NetEye with Elastic APM and OpenTelemetry