10. 07. 2026
NetEye Extension Packs

First of all, I’ll briefly explain what the “Tornado” in NetEye actually is.
Tornado is a Complex Event Processor that receives reports of events from data sources such as monitoring, email, and SNMP Traps, matches them against rules you’ve configured, and executes the actions associated with those rules, which can include sending notifications, logging to files, and annotating events in a time series graphing system like Grafana.
Recently I had a customer who wanted to display their incoming SNMP traps as alerts in NetEye monitoring, and at the same time store them in their Elastic database. (I should mention in advance that the SNMP traps reach the master monitoring system via various NetEye satellites.)
In order to be able to implement this requirement using the standard NetEye installation, I decided to use Tornado. First of all, I created a new data stream called snmptraps-archive in Kibana and gave the user “Tornado” write access to it.
I then created an additional rule in Tornado under the ruleset snmptrap and set up the new Elasticsearch action. The action definition can be seen in the following screenshot:
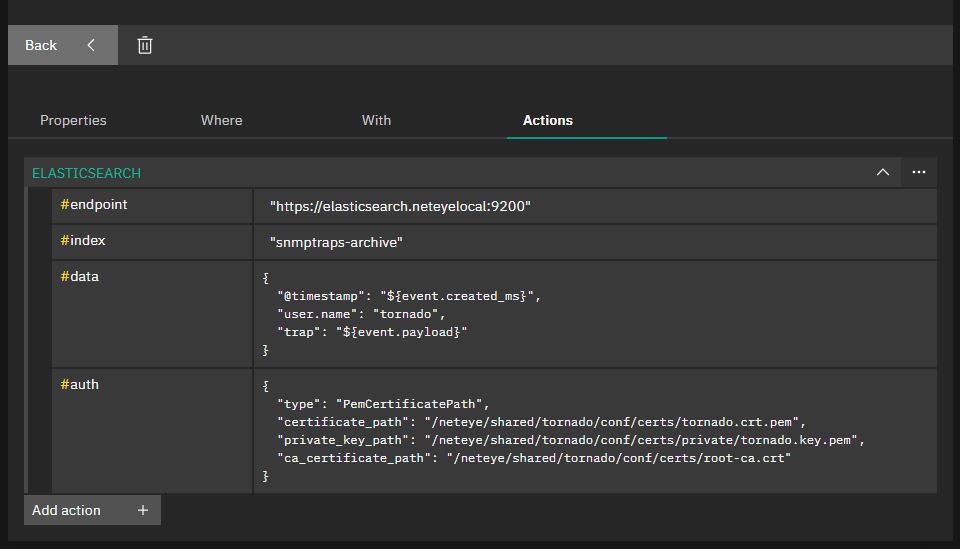
Let me annotate what you’re seeing here.
- #endpoint: The local Elasticsearch server must be specified as the endpoint.
- #index: The index in which Tornado should store the SNMP traps is specified — here it’s the new snmptraps-archive data stream we defined above.
- #data: Here the content of the document must be defined in Elastic, i.e. which fields are written to Elastic by the SNMP trap. In my example I added the @timestamp and a username so I know that this document was written by Tornado, and add the entire trap.
- #auth: In this section we have to set up authentication with Elastic. Since the certificates for the Tornado user are already defined in NetEye, I use them to authenticate myself in Elastic.
As soon as this rule is activated, the traps are written to the desired index.
Have fun trying it out.
These Solutions are Engineered by Humans
Did you find this article interesting? Does it match your skill set? Our customers often present us with problems that need customized solutions. In fact, we’re currently hiring for roles just like this and others here at Würth Phoenix.

Tobias Goller
NetEye Solution Architect at Würth IT Italy
I started my professional career as a system administrator.
Over the years, my area of responsibility changed from administrative work to the architectural planning of systems.
During my activities at Würth IT Italy, the focus of my area of responsibility changed to the installation and consulting of the IT system management solution WÜRTHPHOENIX NetEye.
In the meantime, I take care of the implementation and planning of customer projects in the area of our unified monitoring solution.
Author
Latest posts by Tobias Goller
16. 02. 2026
Unified Monitoring
OpenShift Monitoring in NetEye
13. 10. 2025
Log-SIEM, Unified Monitoring
Elastic Defend: Experiences
18. 07. 2025
Automation, Cloud
Running SOS Berlin JobScheduler in Containers: A Step Toward Cloud-Native Scheduling
16. 04. 2025
NetEye, Unified Monitoring
Application Performance Monitoring in NetEye with Elastic APM and OpenTelemetry