30. 06. 2026
Azure, Cloud, Microsoft, NetEye, NetEye Extension Packs, Unified Monitoring

30. 03. 2017
Patrick Zambelli
NetEye, Unified Monitoring
SAP Monitoring: Experiences with SAPControl and check_SAP_health
On SAP systems there are mapped business processes, which are critical for the organization. Therefore, special monitoring requirements arise. Not just the infrastructure has to be monitored, but also application layers, job executions and failures. It is crucial to understand where problems accumulate, which over time could lead to serious incidents.
If problem indicators can’t be recognized at an early stage, reactive monitoring occurs – the customer, or rather the end user, reports a problem! Mr. Andreas Förster and I organized a workshop at one of our customers to avoid such situations. During the first part of the one-day workshop, the system architecture of SAP was explained and we showed which monitoring approaches exist on server- and application level. During the second more practical part, the discussed monitoring strategy was implemented.
In this article, I’m highlighting some SAP monitoring approaches and show application examples with NetEye:
- SAP-external monitoring: Checking system instances and processes with „SAPControl“
- SAP-internal monitoring: CCMS Alert Monitor to request runtime data, resource usage and job executions
SAP-external monitoring: Checking system instances and processes with “SAPControl”
This approach is targeted to the monitoring on the application layer. In principle, with this tool it is possible to start/stop instances, to examine the runtime environment and to read the system log. The requests are based on SOAP WebServices and can be done with HTTP, but also with certified HTTPS. The configuration of ACLs (Access Lists) on SAP side, allows the control of the monitoring system that should get access. With this approach, no login on the SAP system is required.
A typical use case for SAP-external monitoring is the request of the kernel version of the SAP instance. By the implementation of the monitoring it is possible to guarantee that after the rollout of an update all systems are operating the same version. Another, common source of errors is the expiration of the certificates, but also this can be monitored in the described way.
The SAPControl webservices, which are allowed for the monitoring should be restricted with the SAP profile parameter “service/protectedwebmethods”. Example:
service/protectedwebmethods = SDEFAULT -GetVersionInfo -GetAlertTree -GetAlerts -EnqGetStatistic -GetQueueStatistic -GetInstanceProperties -GetSystemInstanceList -ReadLogFile -ListLogFiles -AnalyseLogFiles -ABAPReadSyslog -ABAPGetComponentList
Details can be found SAP note “1439348 – Extendet security settings for sapstartsrv”.
Preparing the monitoring infrastructure: The SAPEXE is needed, which can be taken from the SAP customer portal. The SAPControl and the required libraries can be extracted from the SAPEXE.
# ./SAPCAR -xvf SAPEXE_400-20012215.SAR sapcontrol libicuuc.so.50 libicudata.so.50 libicui18n.so
Hint: The versions and dependencies can vary from version to version.
As soon as the SAPControl and the libraries are ready, the “LD_LIBRARY_PATH” can be communicated and called via export LD_LIBRARY_PATH=/opt/sap/lib SAP host, serial number and function to be called are required. A first step may be for example the request of the system version.
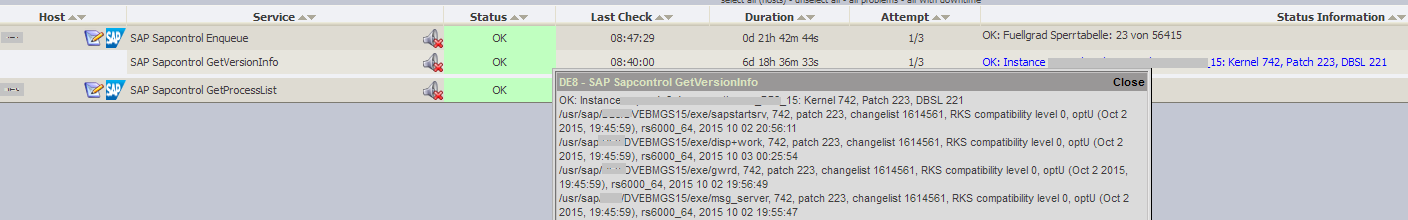
./sapcontrol -nr 01 -host sap.mydomain.lan -prot NI_HTTP -function GetVersionInfo
15.11.2016 10:10:06
GetVersionInfo
OK
Filename, VersionInfo, Time
/usr/sap/SID/DVEBMGS15/exe/sapstartsrv, 742, patch 223, changelist 1614561, RKS compatibility level 0, optU (Oct 2 2015, 19:45:59), rs6000_64, 2015 10 02 20:56:11
/usr/sap/SID/DVEBMGS15/exe/disp+work, 742, patch 223, changelist 1614561, RKS compatibility level 0, optU (Oct 2 2015, 19:45:59), rs6000_64, 2015 10 03 00:25:54
/usr/sap/SID/DVEBMGS15/exe/gwrd, 742, patch 223, changelist 1614561, RKS compatibility level 0, optU (Oct 2 2015, 19:45:59), rs6000_64, 2015 10 02 19:56:49
...
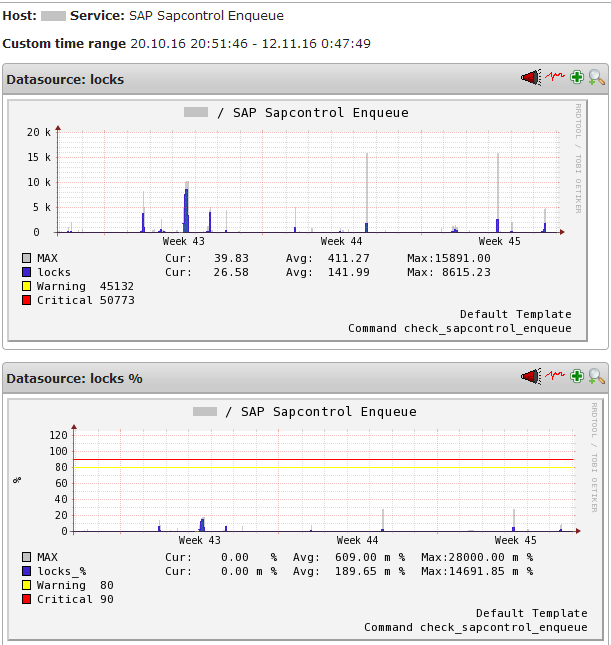
Further possibilities are requesting running processes, CPU consumption or entries in the lock table.
./sapcontrol -nr 01 -host sap.mydomain.lan -prot NI_HTTP -function GetProcessList
15.11.2016 10:12:06
GetProcessList
OK
name, description, dispstatus, textstatus, starttime, elapsedtime, pid
disp+work, Dispatcher, GREEN, Running, 2016 10 16 17:56:50, 67:52:08, 9242666
igswd_mt, IGS Watchdog, GREEN, Running, 2016 10 16 17:56:50, 67:52:08, 4522234
gwrd, Gateway, GREEN, Running, 2016 10 16 17:56:52, 67:52:06, 20251724
icman, ICM, GREEN, Running, 2016 10 16 17:56:52, 67:52:06, 17107024
SAP-internal monitoring: CCMS Alert Monitor to request runtime data, resource usage and job executions
The analysis of job-runtimes or available RFC-connections are made with the SAP-internal approach. To do so, SAP monitoring metrics are read out, which are already collected by SAP by default. These metrics are collected by the Computing Center Management System (CCMS) and can be read out via RFC request.
In this case, the requests are directed to the CCMS-service on the SAP instance. In this way, an extensive configuration of a central Solution Manager architecture, as for example Landscape Virtualization Management (LVM) is not necessary. An additional advantage of such a decentralized request-architecture is the direct management of the SAP monitors within the SAP instance. Contemporaneously, the distances of the requests are shortened because information can be retrieved directly from the system on which they occur and a “single point of failure” is avoided.
Hint: For the configuration of the access permissions it is better to create the user within the “000” client. The client “000” provides insights into all information to the SAP system. Whereat, no user- and customer data are stored.
Reading out metrics via CCMS can be done with check_sap_health . Check_sap_health is developed as community project (https://labs.consol.de/nagios/check_sap_health/) and offers a variety of request methods.
Call of check_sap_health
This call connects itself over the user with the SAP system, whereby a valid user with access data for the system and the client has to be created. For simplifying the configuration, we added a wrapper script that reads the data from a configuration file. So the indication of the SID becomes necessary. Data regarding client, system number, username and password are taken from the configuration file.
cat /etc/nagios/neteye/sap/nag_sap.cfg
SID SYSNR MANDANT SAP-USER PASSWORD
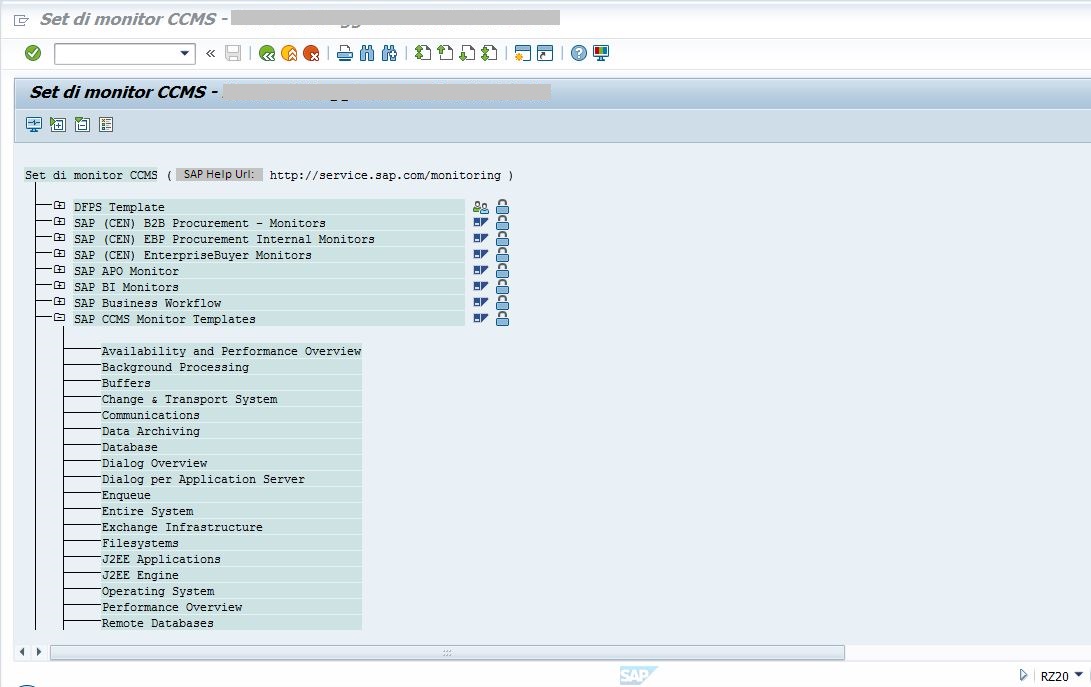
As soon as the access data and the wrapper-script “check_sap_health_run.sh” are deposited, a first connection with “–mode connection-time” can be tested. In case of a positive test outcome, the very handy method “list-ccms-monitors” can be used to read the tree structure of the available monitors out.
./check_sap_health_run.sh --mode list-ccms-monitors --r3name SID
SAP CCMS Monitor Templates
Availability and Performance Overview
Background Processing
Buffers
Change Transport System
Communications
Data Archiving
Database
Dialog Overview
Dialog per Application Server
Enqueue
Entire System
Filesystems
J2EE Applications
J2EE Engine
Operating System
Performance Overview
Process Integration
Remote Databases
An example view of the CCMS monitors in the RZ20-module:
Now, it is possible to read out a further information using the argument “name2”: “list-ccms-mtes” allows i.e. reading out of the monitors in the area “Performance Overview”:
./check_sap_health_run.sh --r3name SID --mode=list-ccms-mtes --name "SAP CCMS Monitor Templates" --name2 "Performance Overview"
SID_appsap01_SID_10_CPU_CPU_Utilization 100
SID_appsap01_SID_10_CPU_Utilization 100
SID_appsap01_SID_10_Dialog_DBRequestTime 100
SID_appsap01_SID_10_Dialog_Load+GenTime 100
SID_appsap01_SID_10_Dialog_QueueTime 100
SID_appsap01_SID_10_Dialog_ResponseTime 100
SID_appsap01_SID_10_Dialog_UsersLoggedIn 100
SID_appsap01_SID_10_Paging_Page_In 100
SID_appsap01_SID_10_Paging_Page_Out 100
SID_appsap01_SID_10_Program_Swap 100
SID_appsap01_SID_10_R3MemMgmtResources_EsAct 100
SID_appsap01_SID_10_R3MemMgmtResources_HeapAct 100
SID_appsap01_SID_10_R3RollPaging_R3RollUsed 100
_Dialog 199
_Memory Management 199
_Operating System 199
_Performance Overview 199
_SID\app01_SID_10 199
OK
„name3“ allows to read out a specific monitor and to define thresholds for it. As mode we use now “ccms-mte-check”:
./check_sap_health_run.sh --ashost sap.mydomain.lan --r3name SID --mode=ccms-mte-check --name "SAP CCMS Monitor Templates" --name2 "Performance Overview" --name3 "SID_appsap01_SID_10_CPU_Utilization"
OK - CPU Utilization = 0% | 'CPU_Utilization'=0%;90;98;0;100
In this example, also the threshold provided by the CCMS is overwritten:
./check_sap_health_run.sh --ashost sap.mydomain.lan --r3name SID --mode=ccms-mte-check --name "SAP CCMS Monitor Templates" --name2 "Performance Overview" --name3 "SID_appsap01_SID_10_CPU_Utilization" --warning 80 --critical 90
OK - CPU Utilization = 0% | 'CPU_Utilization'=0%;80;90;0;100
Thanks to the compact knowledge transfer during the workshop, all participants were able to extend the monitoring of the SAP environment autonomously.
Summing up, I can look back on a very productive day. In case you desire to deepen the topic of SAP monitoring, don’t hesitate to contact us: neteye@wuerth-phoenix.com

Patrick Zambelli
Project Manager at Würth IT Italy
After my graduation in Applied Computer Science at the Free University of Bolzano I decided to start my professional career outside the province. With a bit of good timing and good luck I went into the booming IT-Dept. of Geox in the shoe district of Montebelluna, where I realized how a big IT infrastructure has to grow and adapt to quickly changing requirements. During this experience I had also the nice possibility to travel the world, while setting up the various production and retail areas of this company. Arrived at Würth Phoenix (now Würth IT Italy) I started developing on our monitoring solution NetEye. Today, in my position as Consulting an Project Manager I am continuously heading to implement our solutions to meet the expectation of your enterprise customers.
Author
Latest posts by Patrick Zambelli
16. 01. 2024
NetEye, Unified Monitoring
Icinga 2 DSL for Defining the Monitoring Status of Objects with Director
23. 12. 2020
NetEye
Tornado – Getting in Action with Sample Rules
05. 05. 2020
NetEye, Unified Monitoring
Import Data Correlation and Automation with Icinga2 Director