Multi-Level Dashboarding with Grafana – Use Case: NetEye ITOA | Alyvix
Data collection is one of the key steps when you want to analyze the current state of your network, system or application in terms of performance. Data visualization is another: even the most sophisticated data collection cannot help you solve problems if it is visualized poorly.
Nowadays a single visualization is often not enough since the same dataset might be relevant to different people at a different level of detail, or in combination with other data. This is one of the strengths of NetEye IT Operations Analytics [ITOA]. NetEye ITOA uses InfluxDB as a homogeneous underlying data source, where all data (e.g. performance metrics, user experience data, and customer specific data) are saved with very high precision. Thus the data registration process is kept simple and data is not saved in a way specific to a single visualization. Once that raw data is within the database, it can be immediately used for visualization. In addition, metrics can be post-processed via continuous queries or external post-processing routines (e.g. anomaly detection) to enrich the information that can be visualized via query. NetEye ITOA relies on the state of the art Grafana dashboarding tool. Below I will demonstrate how multi-level dashboards are the key to keeping data analysis and troubleshooting as easy as possible.
Scope-Specific Dashboards
Each Dashboard can be expected to answer one or more questions. The user that opens the dashboard wants to immediately get an answer to his question by looking at the data represented in the dashboard. It is therefore important that there is sufficient information in the dashboard to find the answer, but not so much as to confound the user. Let me make this clearer by taking the Alyvix User Experience within NetEye ITOA as an example (check out more details concerning our synthetic monitoring solution Alyvix http://www.alyvix.com/the-new-alyvix/).
NetEye ITOA and the Role of Alyvix
NetEye ITOA is a monitoring solution that combines traditional performance monitoring with User Experience. Standard performance metrics are recorded along with more sophisticated customer- or setting-specific metrics. The real strength of the solution is that performance is not seen as something that stands alone, but as something that is perceived. Wuerth Phoenix’s active User Experience solution Alyvix is seamlessly integrated into NetEye ITOA, and customer-specific test cases can be designed to convey a clear idea of the User Experience at any point in the day. Such a test case could for example check whether key transactions of one of your business critical applications have a stable duration over time.
The advantage of the combination of performance metrics and User Experience is manifold. First of all, it is possible to quickly see whether there really is something slower than usual. Rather than relying on your end users complaining, you can have an unbiased measurement and can quantify the effect. Second, when you find a time period with poorer performance (e.g., longer transaction durations) you can immediately zoom in to the complete range of performance metrics of your system for that very same time period. Third (the complement of the second), when you discover a performance issue in your performance metrics, you can immediately check whether or not there was a perceivable effect on the user experience. This comes in extremely handy when applying changes to your hardware or software. You can check the impact on your system performance and potentially related changes to user experience right away. But what does this look like in practice?
First Level – Overview: Is everything all right?
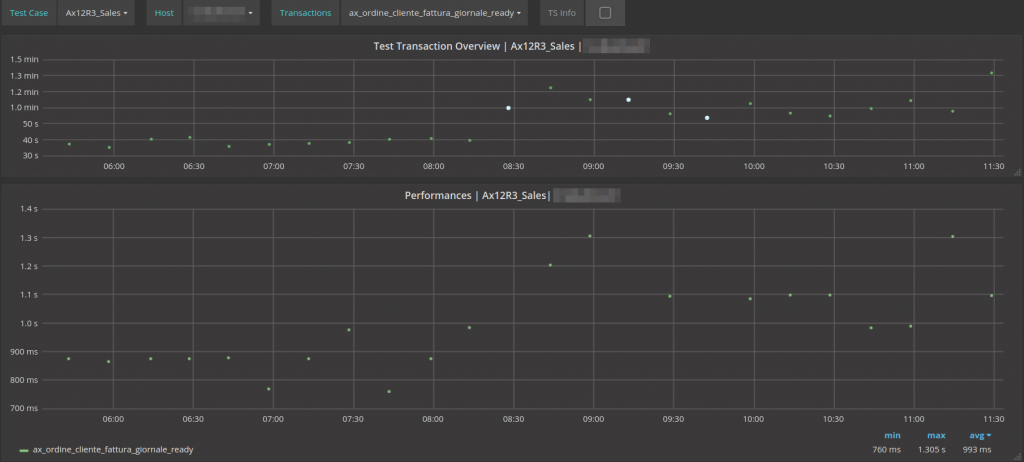
Alyvix test case output data (see the bottom row of the panels below) are durations of a sequence of transactions. Typically, a test case is designed to focus on the key steps that users perform when using an everyday business-critical application (e.g. creating an invoice, inserting a new customer, etc.) Changes in the duration of a single transaction or group(s) of them indicate either improvement or issues, especially when the changes show up over a larger scale.
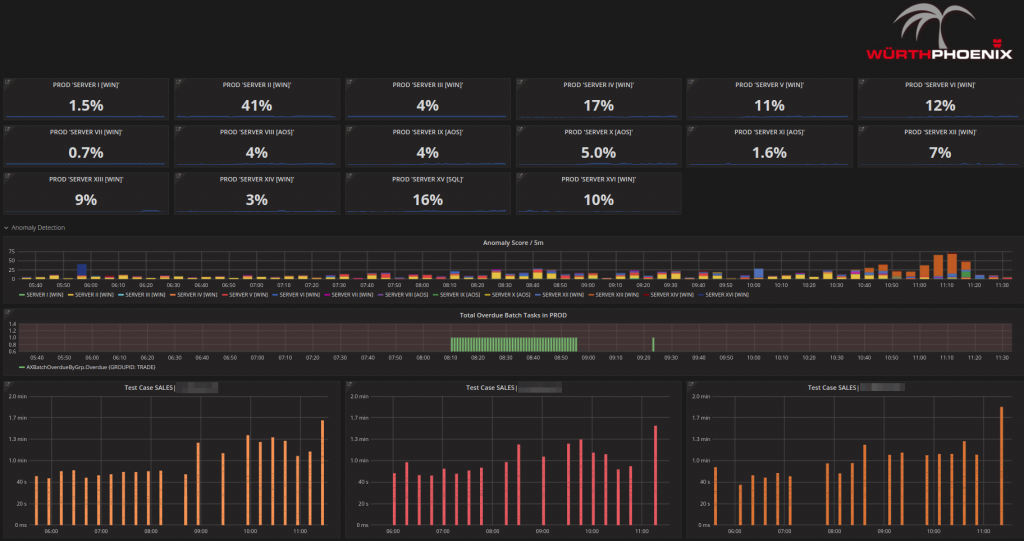
At a macroscopic level, you might not be interested in too many details for single transactions. You might instead look for answers to questions as simple as:
- Are my tests running?
- Can each transaction of the test be performed?
- Is the overall test duration in accordance with my expectations?
This is what the first level of NetEye ITOA Dashboards provides answers to. Instead of many transactions, there is a single bar that indicates the overall duration of the complete test. If that particular test failed (e.g. went into a time out, or could not perform any of the transactions), then no bar is shown, even if it has been partly executed. Changes in the overall test duration become more easily visible that way.
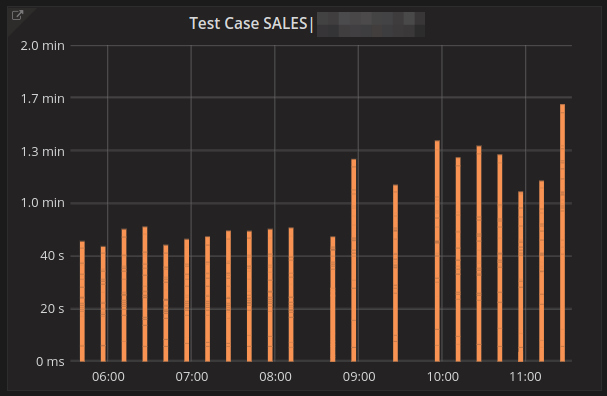
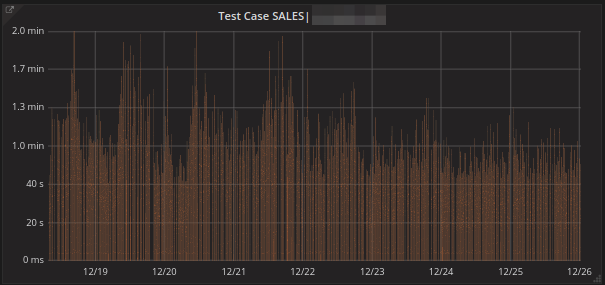
This is quite handy for example when you want to have a look at day/night, working day/holiday effects, or to check whether some changes you applied last week are already having an impact.
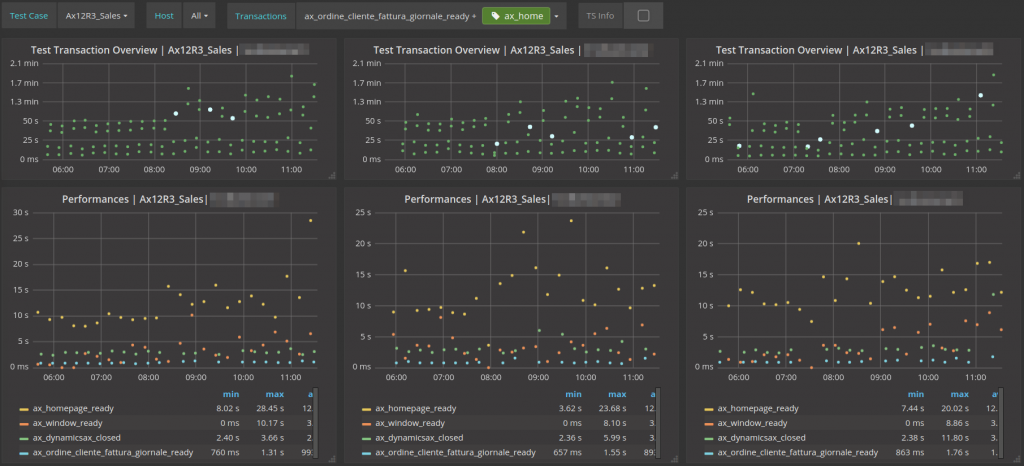
Second Level – Multimeasure: How are we doing on average?
Instead of the macroscopic view, you might be more interested in detailed average statistics for each transaction in the test cases. For the human eye it is much easier in that case to interpret curves instead of bars. So the question is no longer whether something is running or not, but how well and/or stable it is running compared to historic values.
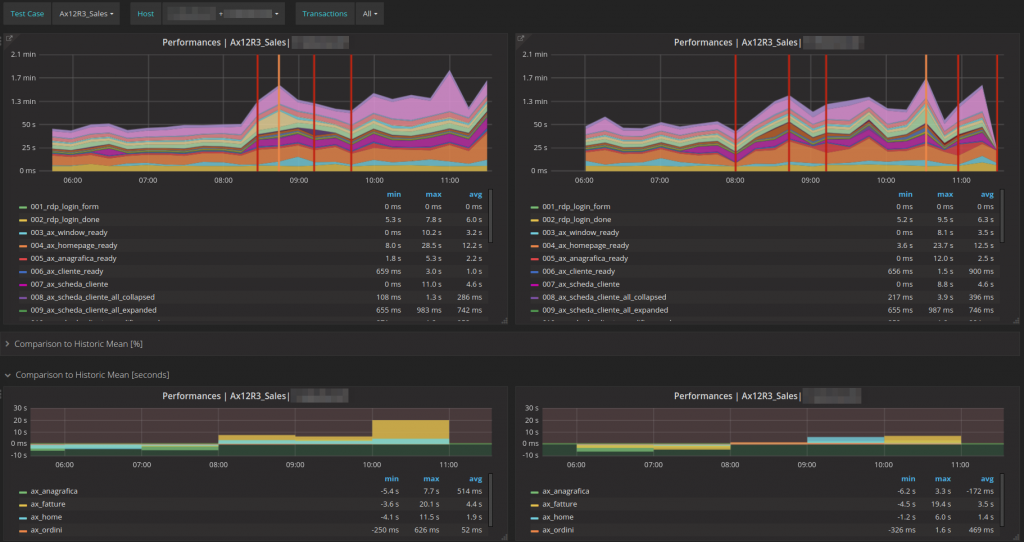
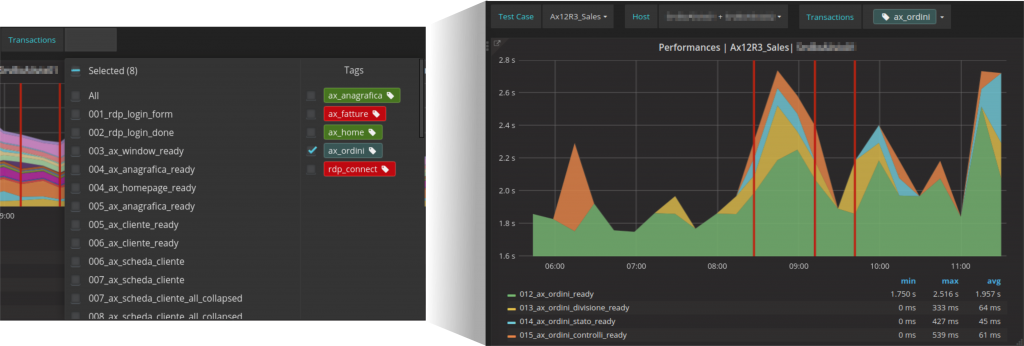
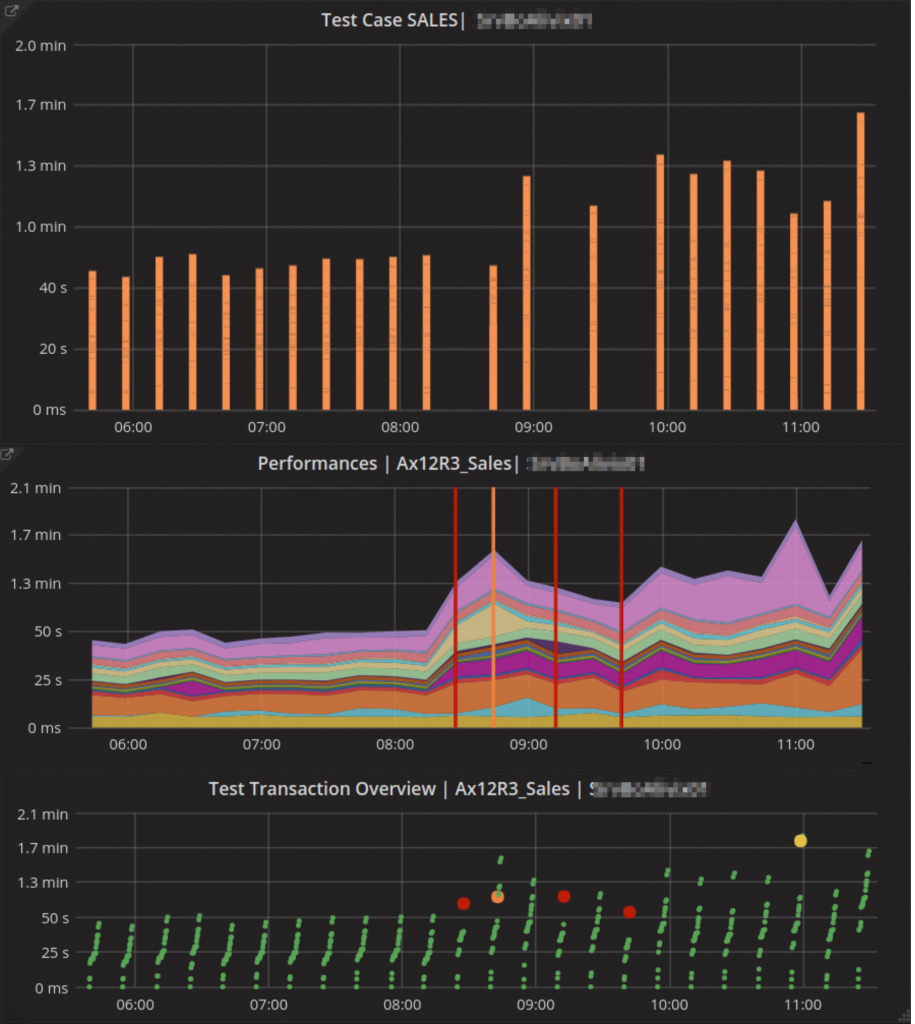
You might have noticed that the holes in the bar chart from Level 1 have names now. For instance, for the first probe (top left) the three holes were actually due to a test that had failed (the red lines). Furthermore, there was one test execution that went into critical (the orange line) because at least one transaction took more time than expected.
You can drill down to find out more information about the problem by checking the boxes for single transactions or subgroups of transactions, while turning off all the other curves that represent correct (but distracting) test cases.
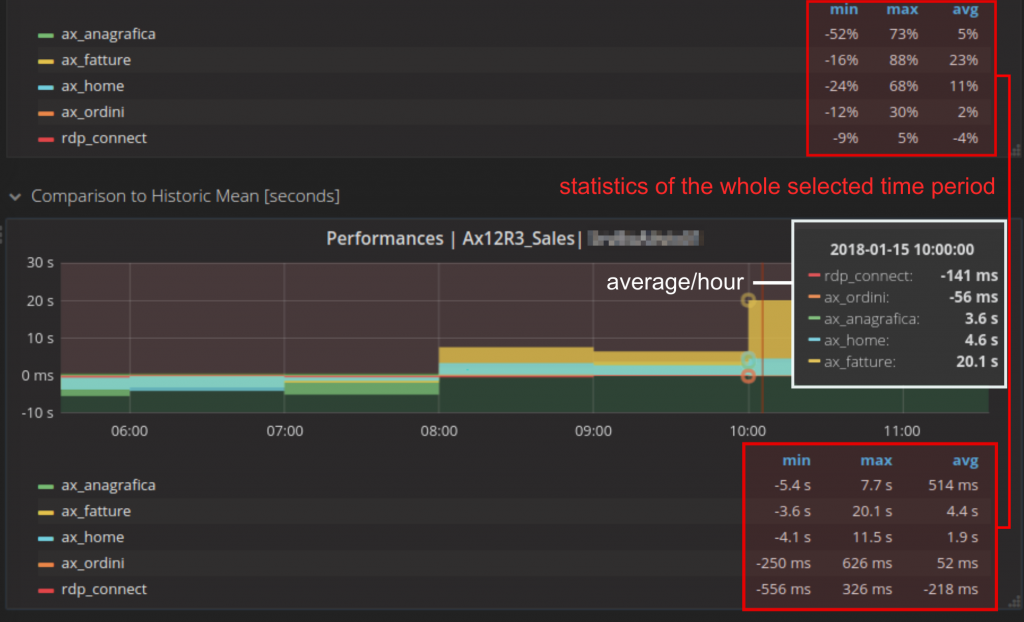
The group statistics below compare current performance to that reached by all transactions that had an OK status over the last 7 days. By scrolling along the horizontal axis, you can see these average values per hour in the tables below, along with the minimum and maximum values over the entire time period selected.
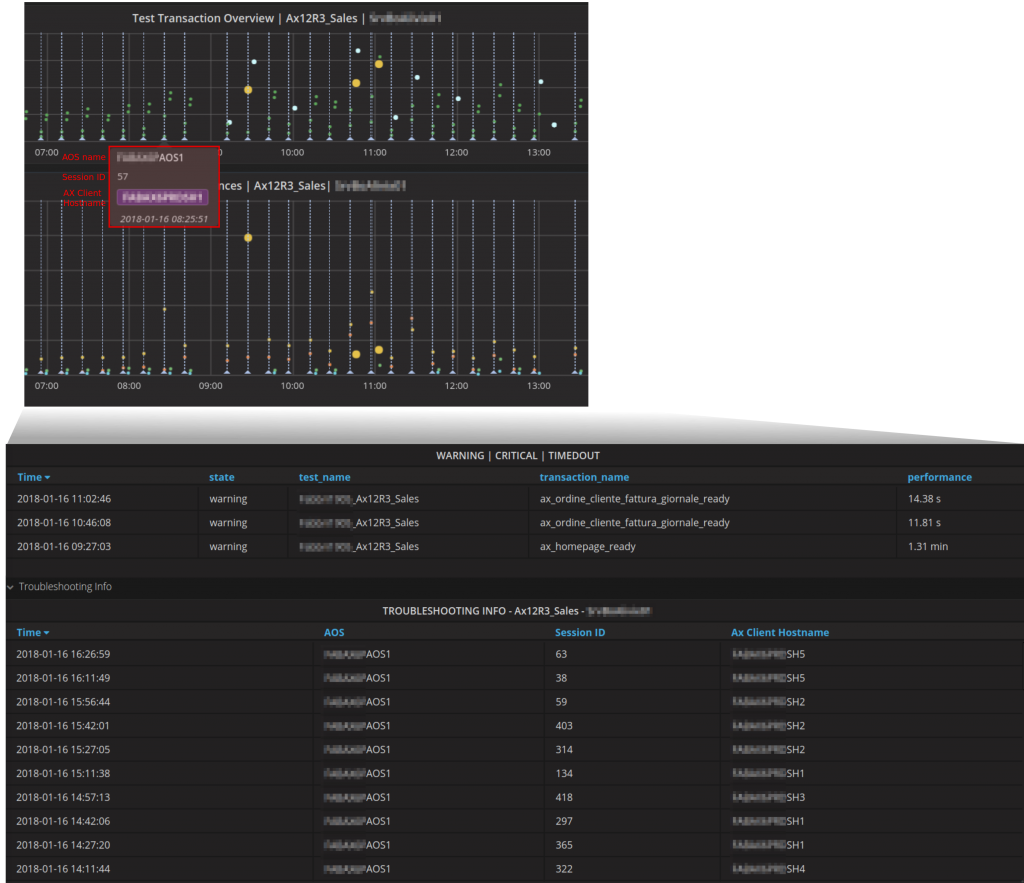
Third Level – Detailed Troubleshooting: What happened in detail?
Above we saw graphs that might be useful for those who only need a macroscopic view, and for those interested in statistics. Now let’s explore how deep we can go, with how much detailed data can be addressed during troubleshooting if necessary.
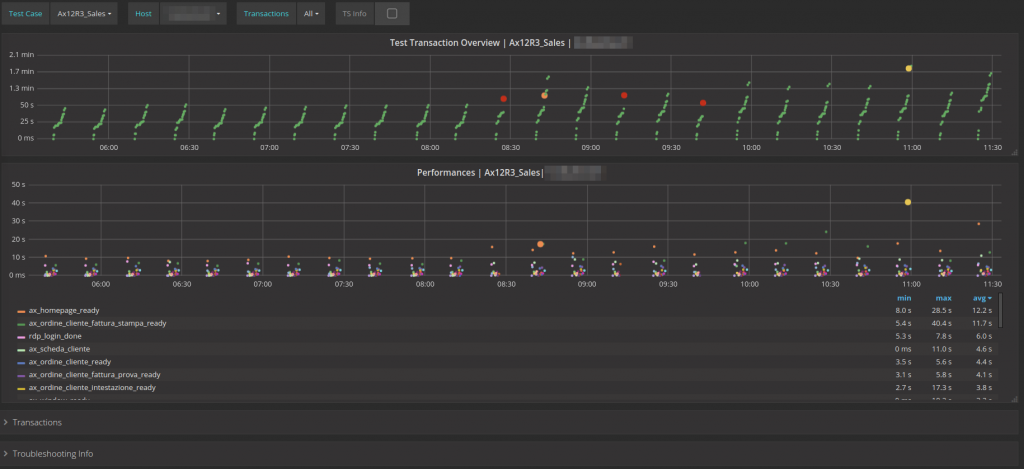
Each single transaction becomes a data point with a certain duration, state, and related information that makes it possible to dig further into the problem you are dealing with.
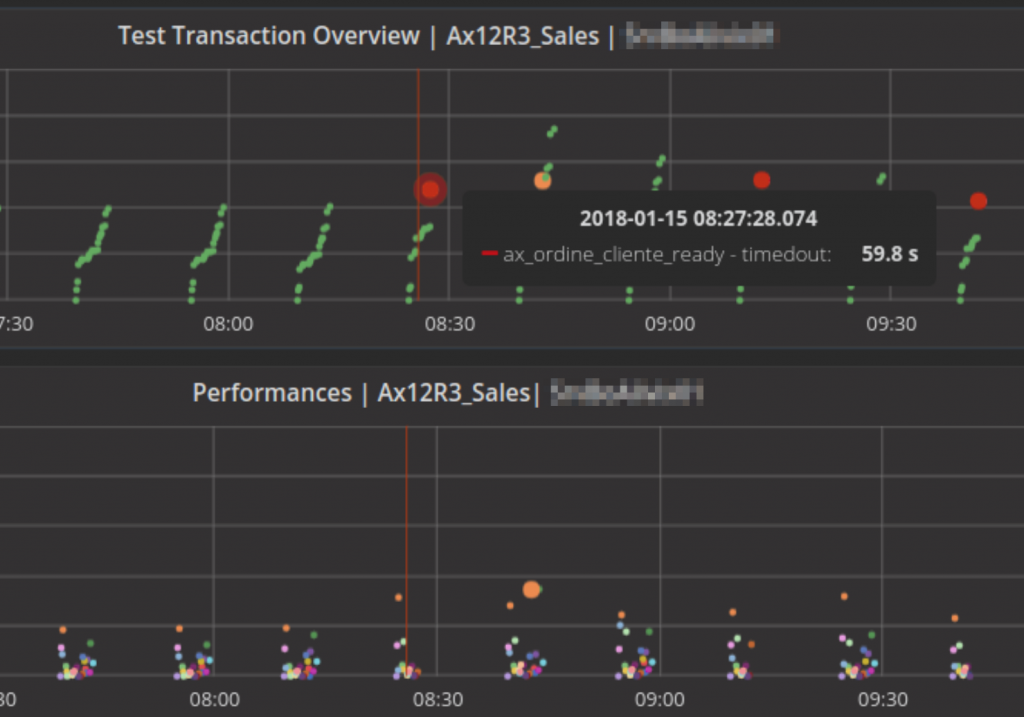
You can see which transaction made your test break:
Monitor a single transaction over time:
Study whether behavior on the same test-case for different probes is the same (different probes can be located at different places e.g. countries, levels of a building, and so on):
Or go even deeper by displaying troubleshooting information such as session IDs, AOS Application Server for Microsoft Dynamics AX 2012 (which test was performed on), or the application client’s host name straight into your data or as a summary table below:
Conclusion
The very same data can look quite different depending on the degree of detail. The important point is that this degree of detail needs to be in accordance with the question you are trying to answer. NetEye ITOA’s Dashboards make it possible to easily switch between different levels, and thus different degrees of detail.
We believe that rapid exchange of information between different groups working on related problems (Support getting calls that something is slow, a system administrator applying changes, a manager wanting feedback on whether the upgraded hardware really had the promised effects, etc.) is essential and the right degree of detail and complexity makes their collaboration and the solution to the underlying problem even faster. NetEye ITOA’s user experience is only a tiny part of the complete solution. Stay tuned to our blog if you would like to hear more about performance monitoring with dashboards. But for all types of dashboards (performance metrics, batch analysis, anomaly detection), the logic behind the multiple-level dashboards remains the same: navigation between them, maintaining the selected time period, and all the other variables.