30. 06. 2026
Azure, Cloud, Microsoft, NetEye, NetEye Extension Packs, Unified Monitoring

The development of a software solution requires automated quality control to deliver a better customer experience. Our Unified Monitoring solution is based on a best-of-breed approach using tried-and-trusted open source tools. In our vision, the development processes should deliver integrated solutions through automated systems which manage not only the building and verification of the software modules developed, but in addition the validation of their interactions.
In this post, I want to give you an overview of our testing process, mainly focused on the new tests integrated in NetEye 4 to simulate user interaction with the graphical interface.
A Short Introduction to our Continuous Integration System
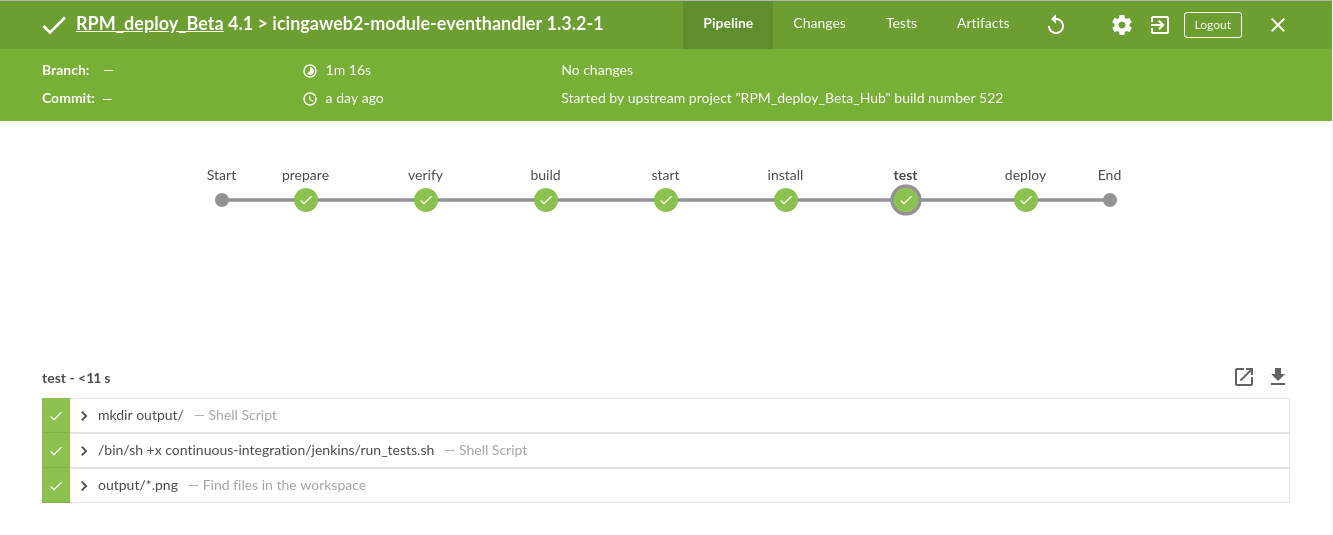
Our R&D team has deployed a Continuous Integration process (based on Jenkins) which consists of the following steps:
- Preparation and verification of the build process, which includes starting up a dedicated environment (i.e., a Docker container) and resolving all dependencies
- Building the modules affected by the changes (e.g., bug fixes, features, etc.)
- Booting up the product (e.g., NetEye) with its services and modules, and installing the new, just-built changes
- Testing based on three different approaches:
- Unit Tests to verify that the procedure for each submodule is compliant with expectations;
- Integration Tests to test modules as a group by evaluating their interactions and communications (e.g., interactions with a database or between modules)
- Graphical User Interface testing to ensure integrity from the user’s perspective
- Automated deployment in test environments
Graphical User Interface Testing
In recent months, we extended our Continuous Integration system to support automated GUI tests leveraging the Selenium Suite. The R&D Team developed test cases for each NetEye 4 module, and these are launched automatically during the test phase of our Continuous Integration process.
The following video shows one simple test case which includes logging on to the web GUI, the creation and modification of a new rule in the Event Handler module of NetEye 4, and verification of all drop down menus. Note that the video is not accelerated, and the actions, such as clicking and typing, are carried out by the automated process, without any user interaction required.
These Graphical User Interface tests are not only useful for verifying the integrity of the modules and their interactions, but also for ensuring that the software still performs the same way even after making changes or adding new features. In other words, to avoid regressions which are particularity critical for end users.

Michele Santuari
Software Architect at Wuerth Phoenix
Hi, my name is Michele Santuari and I am a Telecommunication engineer felt in love with OpenFlow, the first attempt of centralized network management, provisioning, and monitoring. I embraced the Software Defined Networking approach to discover a passion for programming languages. Now, I am into Agile methodologies and crazy development process management.
Author
Latest posts by Michele Santuari
28. 12. 2020
Development
Research & Development – Spike (Part 4)
23. 12. 2020
Development
RPM/ISO Repository: Disk Space Optimization
05. 10. 2020
Development, NetEye
Research Activities: A Fully Distributed NetEye