
21. 11. 2018
Juergen Vigna
ITOA, NetEye, Predictive Analysis, Unified Monitoring
Manage the Performance of your MSSQL Databases
So you have MSSQL databases and you’d like to keep an eye on the performance of your DB. Using NetEye this is quite easy. The tools you need are already available on your NetEye server: InfluxDB, the Telegraf agent, and Grafana for visualizing your Dashboards.
The SQL Server Input Plugin provides metrics for your SQL Server instance. It currently works with SQL Server versions 2008 and later. Recorded metrics are lightweight, and employ the dynamic management views supplied by SQL Server. What you need then is a login for your SQL Server created more or less with the following commands:
USE master;
GO
CREATE LOGIN [neteye] WITH PASSWORD = N'mystrongpassword';
GO
GRANT VIEW SERVER STATE TO [neteye];
GO
GRANT VIEW ANY DEFINITION TO [neteye];
GO
On your NetEye server, create a config file (/etc/telegraf/telegraf_mssql.conf) for Telegraf using this template:
[agent]
interval = "30s"
round_interval = true
metric_batch_size = 1000
metric_buffer_limit = 10000
collection_jitter = "0s"
flush_interval = "60s"
flush_jitter = "0s"
precision = ""
debug = false
quiet = false
logfile = ""
hostname = ""
omit_hostname = false
[[outputs.influxdb]]
urls = ["http://127.0.0.1:8086"]
[[inputs.sqlserver]]
servers = [
    "Server=10.0.0.1;Port=1433;User Id=neteye;Password=mystrongpassword;app name=telegraf;log=1;",
]
query_version = 1
Now start a Telegraf agent using that config file. Telegraf will immediately start sending data to InfluxDB. Then go to Grafana and import an “official” Dashboard using the number 4730. You will now have a very nice dashboard with all the performance data for your DB instance.
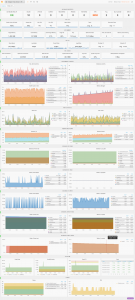
The dashboard provides KPI’s and graphs for metrics collected in real time by the Telegraf agent and stored in InfluxDB:
- Database KPIs
- CPU, memory and I/O KPIs
- Performance counters
- Wait statistics
- Memory break down
- Transaction log activity
- Availability replica statistics
- and many more


Juergen Vigna
NetEye Solution Architect at Würth IT Italy
I have over 20 years of experience in the IT branch. After first experiences in the field of software development for public transport companies, I finally decided to join the young and growing team of Würth Phoenix (now Würth IT Italy). Initially, I was responsible for the internal Linux/Unix infrastructure and the management of CVS software. Afterwards, my main challenge was to establish the meanwhile well-known IT System Management Solution WÜRTHPHOENIX NetEye. As a Product Manager I started building NetEye from scratch, analyzing existing open source models, extending and finally joining them into one single powerful solution. After that, my job turned into a passion: Constant developments, customer installations and support became a matter of personal. Today I use my knowledge as a NetEye Senior Consultant as well as NetEye Solution Architect at Würth Phoenix.
Author
Latest posts by Juergen Vigna
22. 05. 2025
NetEye, Unified Monitoring
Automatic Integration of NagVis Map into Icinga Web 2/NetEye Monitoring