


04. 01. 2023
Asset Management, Unified Monitoring

Have you ever thought that the New York Times on an average Sunday contains more information than a Renaissance-era person had access to in his entire lifetime? (Richard Saul Wurman – Information Anxiety)
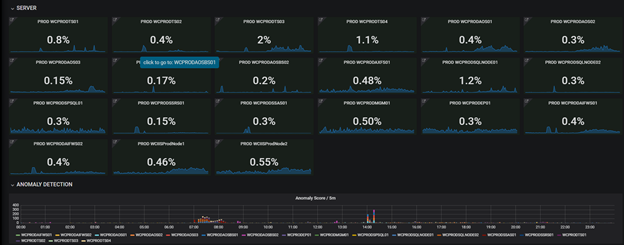
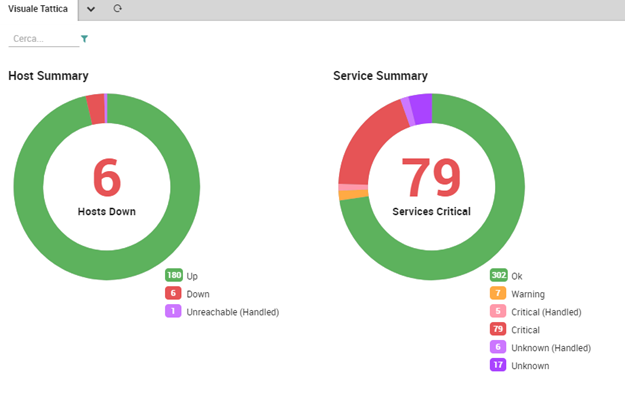
This is what we mean by information overload, and it is especially true when dealing with IT.
Performing sophisticated data analysis no longer requires a research laboratory, just a machine and some code. And although we’re getting better and better at collecting data, we haven’t been able to use it to its greatest potential yet because it’s not being visualized as well as it could be.
The point is, you may be very good at measuring and recording things, but you still need a good method for understanding and communicating this information.
Given the complexity of the data we typically deal with, using it to provide a meaningful solution requires combining insights from diverse fields (from graphic design to data mining) that have evolved independently.
These fields should be managed as parts of a single, overarching process that bridges these individual disciplines, placing the focus on how data is understood rather than on the viewpoint of individual fields.
Ben Fry in the book “Visualizing Data” (Published by O’Reilly Media, Inc.) divides the path to Understanding Data in 7 steps:
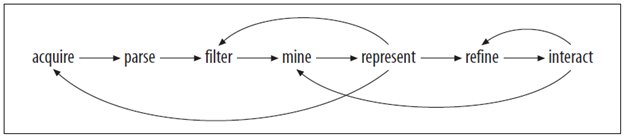
Acquire
Obtain the data, whether from a file on a disk or a source over a network.
Parse
Provide some structure for the data’s meaning, and subdivide it into categories. After you acquire the data, it needs to be parsed — i.e., changed into a format that tags each part of the data with its intended use.
Filter
Remove all but the data of interest. In this step you are going to filter the data to remove those elements irrelevant to the goal of understanding the Data as per the User Perspective.
Mine
Apply methods from statistics or data mining as a way to discern patterns or
place the data into a mathematical context.
Represent
Choose a basic visual model, such as a bar graph, list, or tree. This step determines the basic graphical form that a set of data will take. The Represent stage in a visualization project may make you rethink earlier stages. How you choose to represent the data can influence the first and third steps.
Refine
Improve the basic representation to make it clearer and more visually engaging.
Interact
Add methods for manipulating the data or controlling what features are visible. In this stage you have to let the user control or explore the data. Interaction might cover things like selecting a subset of the data or changing the viewpoint.
You might ask yourself why you should go through such an intensive process instead of buying something already prepared and packaged.
There is just one answer to this question: Packaged solutions can only provide packaged answers.
If you are working with Data, I’m quite sure you know that each project has unique requirements and a unique audience — this is why you need a customized solution to achieve your goals.
Luca Buonocunto
Author
Latest posts by Luca Buonocunto
07. 08. 2019
ITOA
A Roadmap to Continuous Improvement
24. 07. 2019
Log-SIEM, NetEye, Service Management
5 Bullet Points for Information Security Incident Management
06. 11. 2018
NetEye, Service Management
NetEye/EriZone as Enterprise Service Management Governance Enablers