


31. 03. 2026
Asset Management, GLPI, Service Management

04. 01. 2023
Mirko Morandini
Asset Management, Unified Monitoring
Using GLPI with the Metabase Open Source BI Tool for Visualizing Rich Reports and Dashboards
Asset management/CMDB tools play (or should play!) a central role in IT operations and management, gathering data from hardware assets on contracts, software licenses, network configurations, tickets and many more.
The key task is to keep all this data consistent and up to date. Rigor in manual data insertion and the careful integration of automation processes (such as integrations with other tools, network scans, and inventory agents) are the backbone of successful asset management.
A comprehensive and appealing application of data reporting and visualization would be a huge aid in getting and sharing an overview of all the data and for spotting inconsistencies. In the popular OSS asset management system GLPI (which is also contained in NetEye), the dashboards that have been available since version 9.5 give a good overview of the contents of the CMDB, but are hard to configure.
Many companies use powerful, but heavy BI tools, which can only be configured by a few key users or external consultants. In between these two extremes we found Metabase, an Open Source BI tool which is quite easy to install and set up, and that can be integrated into GLPI via the plugin of the same name. Statistics from Metabase can be displayed directly in a GLPI dashboard, and the database structure, with all its foreign keys, can be exported to Metabase with one click.
Several articles are already available that present the use of Metabase in GLPI, but they miss some practical parts. So here I would like to give you some hints for a painless installation and first setup of Metabase and its GLPI plugin.
The simplest way to run Metabase is to use its preconfigured docker image:
yum install docker   [note: this installs 'podman' on RHEL 8!]
docker pull metabase/metabase:latest
Then the docker image can be run in its standard configuration with:
docker run -d -p 3003:3000 --name metabase metabase/metabaseHere we use port 3003 because port 3000 is already in use by Grafana in a standard configuration. If it doesn’t start up, you can find some logs with further information using:
docker logs -f metabase (in RHEL8 with podman: podman images and podman ps)Then remove this test configuration again with docker rm /metabase.
For production use, you should use an external database to get data persistence – I recommend using the mysql instance already used by GLPI, where you then prepare this DB:
CREATE DATABASE metabase CHARACTER SET utf8mb4 COLLATE utf8mb4_unicode_ci;
GRANT ALL PRIVILEGES ON metabase.* TO 'metabase'@'%' IDENTIFIED BY '********';
Now start the docker with the following parameters:
docker run -d -p 3003:3000 \
  -e "MB_DB_TYPE=mysql" \
  -e "MB_DB_DBNAME=metabase" \
  -e "MB_DB_PORT=3306" \
  -e "MB_DB_USER=metabase" \
  -e "MB_DB_PASS=********" \
  -e "MB_DB_HOST=mariadb.neteyelocal" \
   --name metabase metabase/metabase
To start up the Docker instance automatically at reboot, register it with systemctl enable docker (if Docker is installed, e.g. in CentOS7). If your system instead uses podman (e.g. RHEL8), you need to generate a systemd file for the podman container and then register it:
cd /etc/systemd/system/
podman generate systemd --new --name metabase -f
systemctl daemon-reload
systemctl enable container-metabase
Now configure Apache to be able to access Metabase with http(s)://fqdn/metabase/ by creating the file /etc/httpd/conf.d/metabase.conf with the following content:
#set proxy for metabase
ProxyPass /metabase/ http://localhost:3003/
ProxyPassReverse /metabase/ http://localhost:3003/
ProxyPassReverseCookiePath http://localhost:3003/ /metabase/
Restart httpd and access http(s)://<fqdn>/metabase/. At the first access, you will be prompted to create a user and define their password.
Now install the Metabase GLPI plugin (just unzip it into the GLPI “plugins” folder) and configure it: set the username, password, host (localhost) and port (3003). Later, you can also add the Metabase embedded token (retrieved from the user properties) and the fully qualified name, both of which are needed for displaying the dashboard in GLPI.
To set up the GLPI DB in Metabase, you can either click on “generate datamodel in Metabase” in the setup page, or add the MySQL GLPI database to Metabase by hand. Moreover, the plugin can create in Metabase the foreign keys used by GLPI, since they are not explicitly defined in the database. Once all five status lights in the API Status section are green, the connection between GLPI and Metabase has been successfully opened.
Metabase – Questions and Dashboards
Finally, it’s time to log in to Metabase and create your first statistics dashboards. Metabase reports are based on so-called “questions”, database queries that can be defined entirely with a graphical editor or in standard SQL (by selecting “open editor”). The graphical editor supports joins, aggregation, group-by, filters (where-clauses) and limits. The questions can be visualized by selecting from several diagram types or by displaying the results on a table. The outcome can then be published on a dashboard.
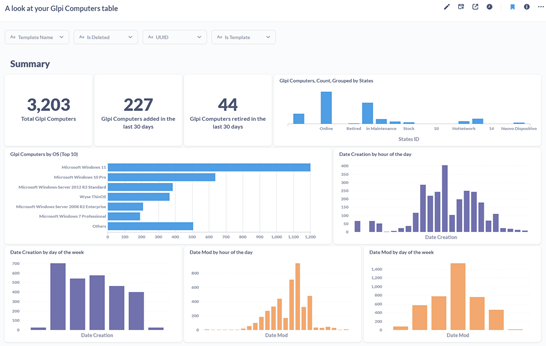
Tons of Metabase tutorials can be found online, and luckily the GLPI database structure is quite understandable, with each database table linked directly to one web page. E.g., the page /computer.form.php represents the table glpi_computers with all its attributes. To start, you can select the glpi_computers table and click on “X-Ray Table”: Metabase will create a dashboard full of simple reports based on the table definition.
Displaying Metabase Dashboards in GLPI
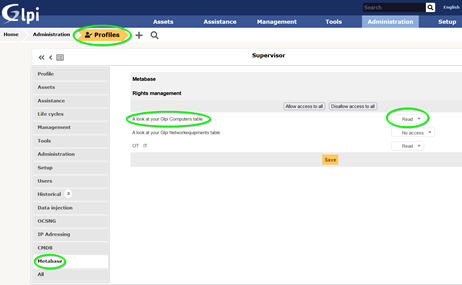
To visualize Metabase dashboards in GLPI, don’t miss one important step: Open the Profiles page, and for each GLPI profile that should be able to visualize the dashboard, go to the Metabase tab and give it the “Read” permission.
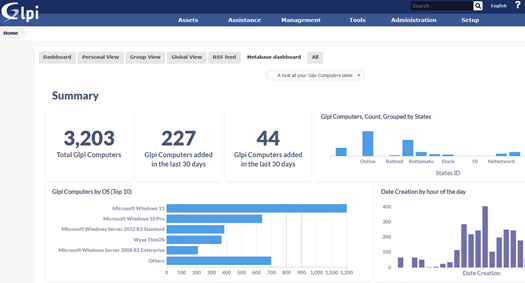
Now, click on the GLPI logo at the top left, change to the “Metabase dashboard” tab and select one of the published dashboards in order to see it. That’s it, have fun with Metabase!
These Solutions are Engineered by Humans
Did you find this article interesting? Are you an “under the hood” kind of person? We’re really big on automation and we’re always looking for people in a similar vein to fill roles like this one as well as other roles here at Würth Phoenix.
Mirko Morandini
Mirko Morandini, PhD, is a senior consultant in IT Service Management and Asset Management, with over a decade of experience and numerous successful projects in Germany, Austria and Italy. As the GLPI advocate at Würth IT Italy, Mirko is passionate about open source solutions - and when he’s not optimizing IT processes, he enjoys spending time with his family and playing and conducting wind band music.
Author
Latest posts by Mirko Morandini
31. 03. 2026
Asset Management, GLPI, Service Management
GROUP-based Asset Permissions in GLPI 11: GLPI Rights Management Redefined
29. 09. 2025
Asset Management, GLPI, Knowledge Management, Service Management
Getting the M(u)st out of GLPI
30. 06. 2025
Asset Management, Unified Monitoring
Das neue GLPI 11 – offizielle deutsche Vorstellung [DE]
31. 03. 2025
Asset Management, GLPI, Knowledge Management, NetEye
GLPI: Automated Inventory Without Using GLPI Agents