
Last week I had to implement monitoring checks for a customer’s host running an IBM iSeries server. As the monitoring for that is a bit particular, I’d like to share what I did, and also share with you an Icinga2 Basket containing the monitoring structure.
Where to Find the Necessary Files
You may download the files needed here. On your NetEye 4 machine you can extract the tar file in the root directory with this command:
tar xvzf iseries.tar.gz -C /
How to Install
You’ll have to create a Service Template with the name “generic-active-service“. I didn’t include this in the Basket as we normally already have this Template inside NetEye4 installations, and you wouldn’t want to overwrite any changes made to it.
If you’ve verified that you either have that Service Template or created it, you can now import the Basket. Do this from the Icinga Director Basket Menu in the Upload section, or you may also import it from the command line by executing the command:
icingacli director basket restore < Director-Basket_iSeries_Monitoring_25da967.json
The iSeries User
Now you have to create a user on your iSeries host. It is VERY important that the user has the rights to access the system over the same menu that “qsysopr” is using. Also, you have to grant rights to access all the stuff you want to monitor. Then you just insert your User/Password inside the file:
/neteye/shared/monitoring/plugins/.as400
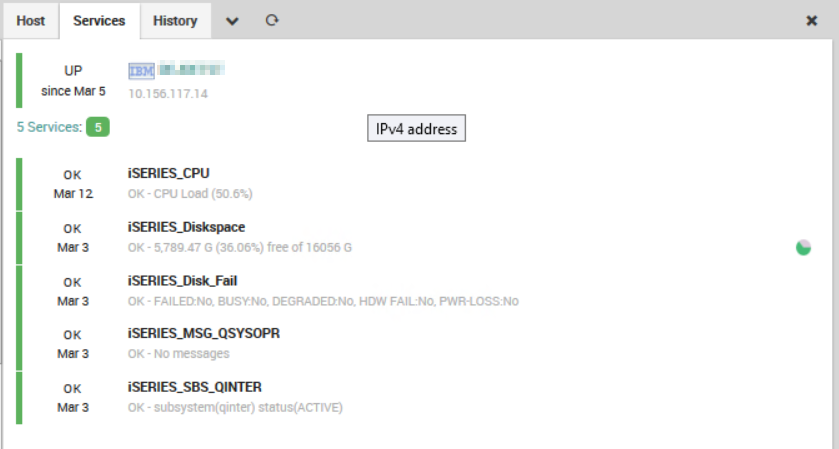
After you’ve done that you’ll have all the Service Templates you need, as well as a Service Set that you may want to add to your iSeries host.
How Does It Work?
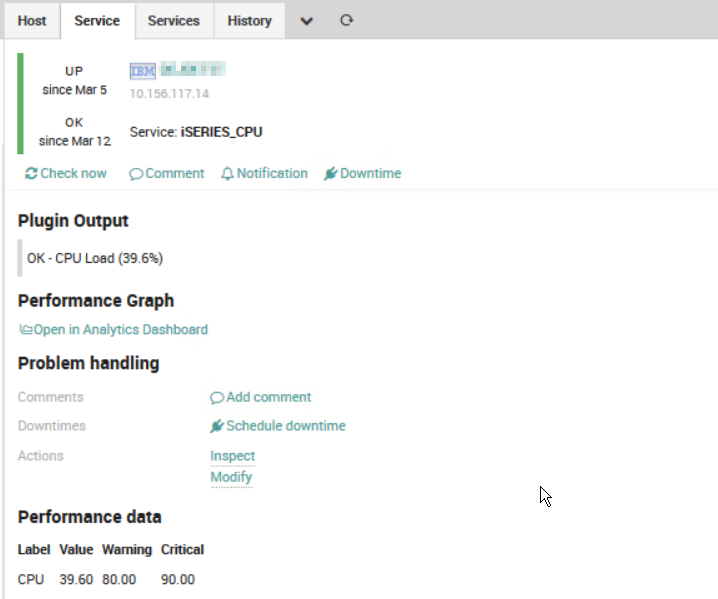
The plugin connects over the telnet protocol to an iSeries Server. Then it follows the “normal” way a user would proceed, inserting a username and password, executing a command, etc. It navigates by reading the screens it gets and waiting until certain strings appear on these screens. Therefore it is important that, as mentioned above, the user has the same menu as the one the plugin was made with (qsysopr).
Multilanguage
The plugin can currently work with iSeries in English, German and Italian.


Juergen Vigna
NetEye Solution Architect at Würth IT Italy
I have over 20 years of experience in the IT branch. After first experiences in the field of software development for public transport companies, I finally decided to join the young and growing team of Würth Phoenix (now Würth IT Italy). Initially, I was responsible for the internal Linux/Unix infrastructure and the management of CVS software. Afterwards, my main challenge was to establish the meanwhile well-known IT System Management Solution WÜRTHPHOENIX NetEye. As a Product Manager I started building NetEye from scratch, analyzing existing open source models, extending and finally joining them into one single powerful solution. After that, my job turned into a passion: Constant developments, customer installations and support became a matter of personal. Today I use my knowledge as a NetEye Senior Consultant as well as NetEye Solution Architect at Würth Phoenix.
Author
Latest posts by Juergen Vigna
22. 05. 2025
NetEye, Unified Monitoring
Automatic Integration of NagVis Map into Icinga Web 2/NetEye Monitoring