
In this blog post I will describe a potential use of Tornado to monitor events in near real-time, while keeping historical information about the received events.
Use Case
Often as a user I want to collect data from different sources, e.g. Windows events, and then according to some simple rules set the status of some Icinga2 “passive” services to warning or critical. This change of status triggers Icinga2 notifications, thus allowing a prompt response to the issues raised. That sounds fine in principle, but currently the data about historical states in Icinga2 services is not clearly represented.
Solution
To have both near real-time monitoring and a clear view of what happened in the past at the same time , we can exploit the NetEye SIEM module and Tornado.
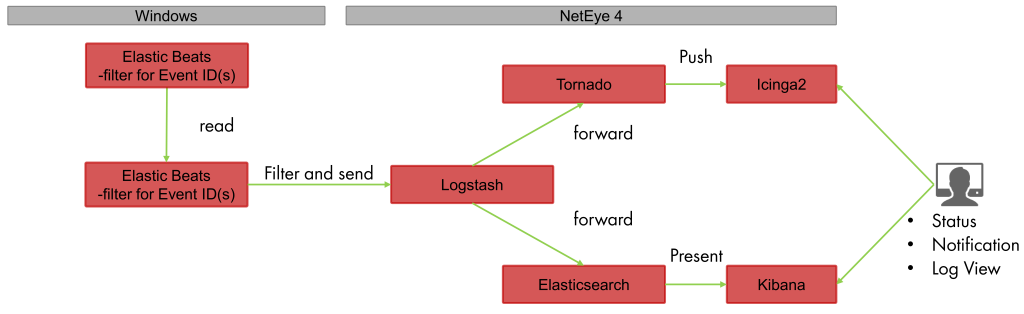
As you can see in the diagram below, the source of data, e.g. Winlogbeat, sends the data to Logstash. Logstash elaborates the data and then forwards it to both Tornado and Elasticsearch. As Elasticsearch indexes the incoming events, Tornado checks if one of its rules applies. If this is the case, it calls the Icinga2 API to change the state of the corresponding Icinga2 passive check; otherwise the document is simply ignored.
Implementation
In this section I will describe how to configure your NetEye instance to implement the aforementioned architecture. If you are only interested in the generic idea, you can safely skip this section.
Tornado Collector Configuration
Tornado must be configured to accept events from a webhook. The most generic configuration for a basic JSON webhook collector is to simply forward the received JSON object “as is” (${@}).
{
   "id": "eventlog",
   "token": "secret_token",
   "collector_config": {
     "event_type": "eventlog",
     "payload": {
         "doc": "${@}"
     }
   }
 }
Tornado Rule Configuration
Now we should configure Tornado rules according to our needs. For example, we can set a host to critical whenever a Windows event on the host is restarted:
{
  "description": "Eventlog 7036 - Event Service Restart",
  "active": true,
  "continue": true,
  "constraint": {
    "WHERE": {
      "type": "AND",
      "operators": [
        {
          "type": "equal",
          "first": "${event.type}",
          "second": "eventlog"
        },
        {
          "type": "equal",
          "first": "${event.payload.doc.winlog.event_id}",
          "second": 7036
        }
      ]
    },
    "WITH": {}
  },
  "actions": [
    {
      "id": "icinga2",
      "payload": {
        "icinga2_action_name": "process-check-result",
        "icinga2_action_payload": {
          "exit_status": "2",
          "plugin_output": "CRITICAL - ${event.payload.doc.message}",
          "filter": "host.name == \"${event.payload.doc.host.name}\" && service.name == \"eventlog-${event.payload.doc.winlog.event_id}\"",
          "type": "Service"
        }
      }
    }
  ]
}
In the real-world implementation, I used Tornado Processing Trees to filter out all events coming from the webhook collector “eventlog”. This example is pretty straightforward and assumes the existence of the monitored host, and the service eventlog-7036 on the host. To overcome this limitation, we can use actions based on icingacli to create services dynamically.
Logstash Configuration
NetEye SIEM’s default Logstash configuration already contains an input for the Beats agents and the output for Elasticsearch. Thus, the only missing part is the Logstash output filter to send data directly to Tornado. This task can be accomplished with the http output plugin:
output {
  http {
    format => "json"
    http_method => "post"
    url => "http://localhost:8080/event/eventlog?token=secret_token"
  }
}
Comparison With Watchers
Another approach used in the NetEye community to perform changes in NetEye when certain conditions are met is the use of Elasticsearch Watchers (which require a SIEM subscription). Watchers are very powerful and permit sending alarms whenever configured Elasticsearch queries and aggregations return non-empty results.
The approach described in this blog post supports less powerful queries, because Tornado rules are matched against single documents and therefore aggregations cannot be performed. Nevertheless, this approach can analyze a real-time stream of events, without having to wait for documents to be indexed, flushed and searched.
The comparison between the two approaches is summarized in the following table:
| Approach | Support Aggregations | Immediate |
| Watcher+Tornado | ☑ | |
| Logstash+Tornado | ☑ |
Conclusion
In this blog I described a potential approach to simulating the good-old-fashioned EventHandler. This approach works on a stream of events and exploits the power of the Tornado Event Processor.

Mirko Bez
Consultant at Würth Phoenix
Author
Latest posts by Mirko Bez
21. 04. 2021
Log Management, NetEye, Unified Monitoring
Automatically Detecting Tornado Anomalies through its Logs
23. 12. 2020
Log-SIEM
How I Became an Elastic Certified Professional