


31. 03. 2026
Asset Management

In this post, I’ll describe a little Proof of Concept (PoC) that I developed to better understand Elasticsearch’s APM-Tracing and Real User Monitoring (RUM). We’ll see how we can use this technology to keep track of interactions between frontend and backend service(s), collect error logs centrally, and see where the bottlenecks are.
I’ll put the focus on how we can use a load balancer, e.g., Nginx (but you can use any other load balancer!) to inject code in the frontend to send Real User Monitoring to NetEye without modifying the source code of the frontend. This can be a huge advantage for developer teams in that they don’t have to take care of this aspect during their application development.
What is RUM?
Real User Monitoring is a type of performance monitoring that captures and analyzes each transaction by users of a website or application.
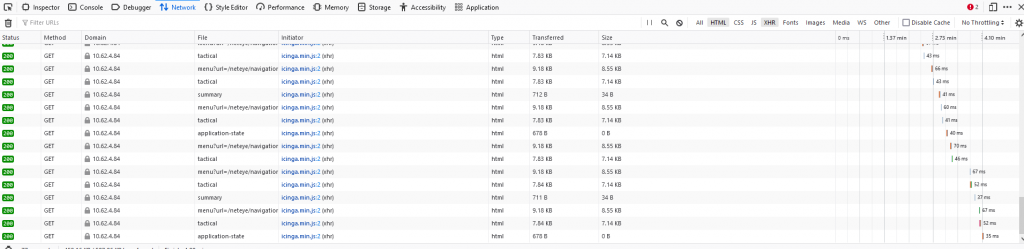
Suppose we want to measure the time needed by the client browser to load external sources and retrieve webpages. If you’re familiar with browsers’ developer tools, we basically want to collect the “Network data” in a central place where we can get statistics results about which pages are slow to load and where the performance bottlenecks are when serving a webpage, and then also collect the console logs in a central store.
Architecture of the PoC
For the sake of simplicity, I used Nginx as an HTTP server that serves a single page application, the frontend. The frontend page can load resources like images from external sources and also perform calls to a backend application. The backend application performs a call to an Elasticsearch instance (a sample DB) and returns a message based on Elasticsearch’s response.
To collect the APM metrics centrally, I used NetEye, where the APM Server is already installed. The APM Server receives the APM metrics and sends them to NetEye’s Elasticsearch.
Configure the Elastic APM Server
The APM Server is already configured in NetEye, but RUM capabilities are disabled by default. We can enable the collection of RUM data by adding the relevant settings, the most important one being:
apm-server.rum.enabled: true
Frontend
To instrument the Javascript applications for RUM capabilities we have many possibilities, but in order to not modify the source code of the pages, auto-instrumentation is required. The most non-intrusive way to do this is to use a reverse-proxy to add these features. Many reverse-proxies allow the administrators to inject HTML code into applications, but in our case we want to inject the download and start of the Elasticsearch RUM Agent.
I used NetEye’s Nginx, but you can use any load balancer of your choice that supports this capability. In the PoC I exploited Nginx’s add_before_body directive.
To force propagation between the traces of the frontend and the one of the backend, I added the following entries to the agent’s configuration:
   distributedTracingOrigins: ['http://10.62.4.84:5000'],
   propageteTracestate: true
The first option whitelists to which origins we can propagate the frontend’s trace state, and the second one enables propagation of the trace state.
Backend
For the sake of the example, I develop a simple Flask Rest API that has only the single endpoint / . This app also makes requests to Elasticsearch. Finally, based on the response of Elasticsearch, it sends a response to the frontend rendered from a Jinja2 template. To explore the capabilities of the agent and to see the error logs, I also integrated some logic to let the call fail 30% of the time.
Flask is one of the technologies supported by the Python RUM Agent. Basically, to instrument a Flask application you need to import the Python Flask agent and initialize it:
from elasticapm.contrib.flask import ElasticAPM

app = Flask(__name__)
apm = ElasticAPM(app)

// the rest of your application
Result
Once the data arrives in the system, we can open the LogAnalytics (Kibana) module of NetEye and navigate to Observability > User Experience. We should see a page similar to the following one:
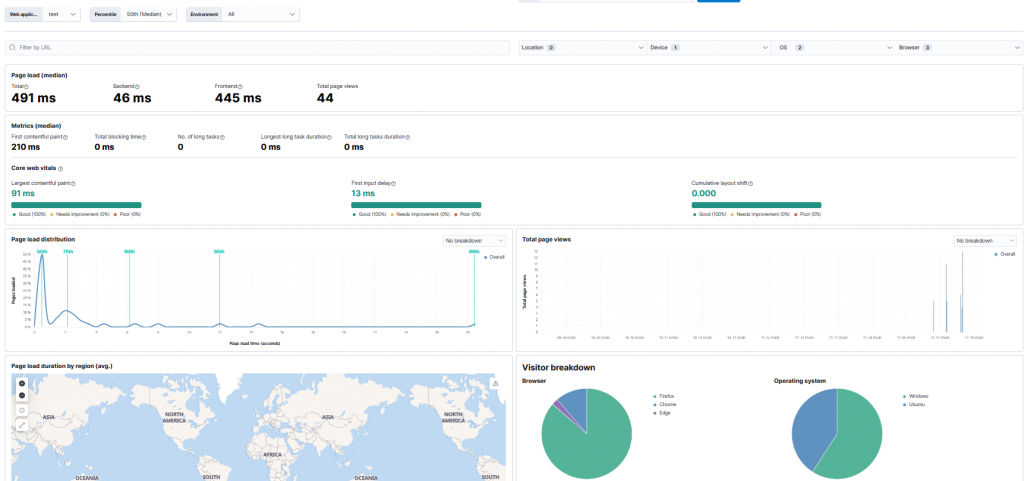
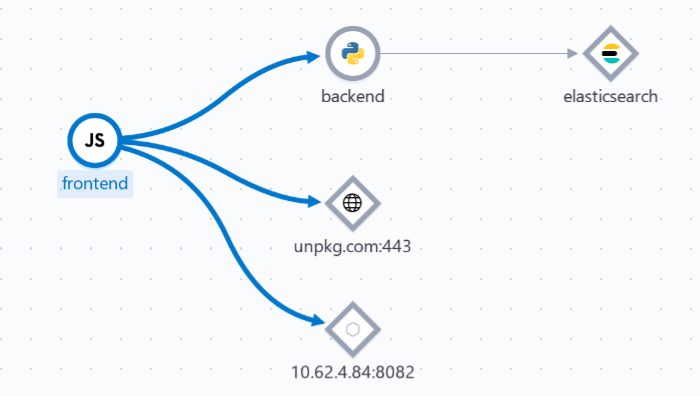
Great! We can see the time needed to load the page and to get visitor breakdown by both browser and operating system. Moreover, the service map shows us the relationship between our simple applications and external resources, which can be very handy to spot any mismatches between reality and expectations:
In addition to these views, we can see the single transactions across frontend and backend and see where time is spent. Furthermore, it shows application errors (if any).
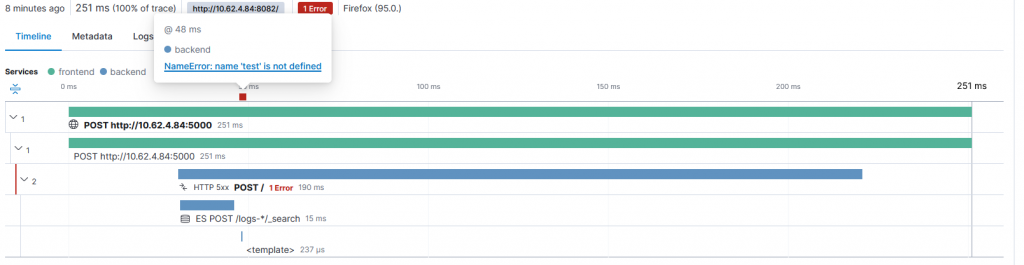
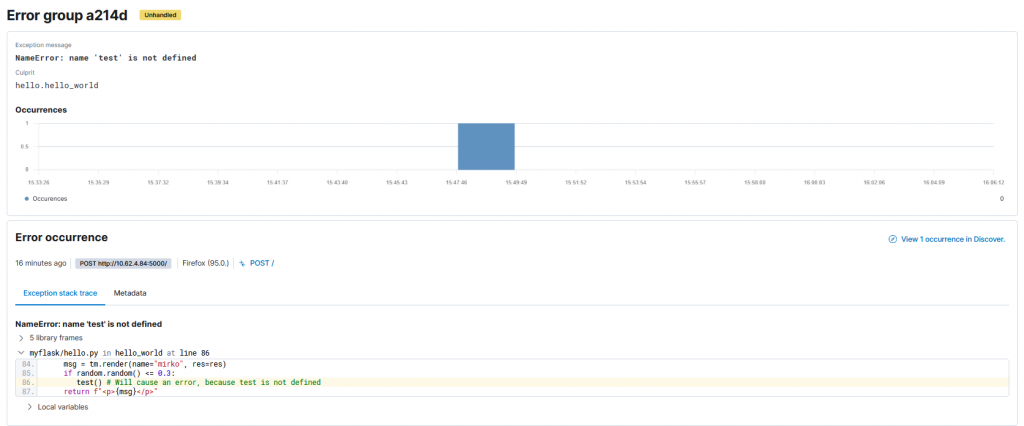
Finally, we can see exactly which line caused the error in the source code by clicking on the error message:
Conclusion
In this post I showed you how to auto instrument Javascript-based applications via Nginx without modifying the source of the webpages. Any other reverse-proxy should do just as well! I also instrumented my backend application to see where the bottlenecks are, and which interactions may cause server errors. With this little Proof of Concept I showed how we can use NetEye to gather insights into both frontend and backend applications. APM and Real User Monitoring are wonderful tools that can be integrated into Acceptance Tests to check if the web requests are performed in a timely fashion without relying on direct user experience.

Mirko Bez
Consultant at Würth Phoenix
Author
Latest posts by Mirko Bez
21. 04. 2021
Log Management, NetEye, Unified Monitoring
Automatically Detecting Tornado Anomalies through its Logs
23. 12. 2020
Log-SIEM
How I Became an Elastic Certified Professional