
21. 04. 2021
Mirko Bez
Log Management, NetEye, Unified Monitoring
Automatically Detecting Tornado Anomalies through its Logs
Tornado is an event-driven engine that substitutes the previous engine called Eventhandler. Its use in NetEye is becoming ubiquitous, and this is just the start! One of its main uses in the NetEye ecosystem is to trigger status changes within Icinga (this in turn will usually send emails to stakeholders). However, understanding exactly what is going on under the hoods is – currently – far from easy.
Indeed as of now, the only way to know if the execution of an action has failed is to open the log and check for errors of a specific kind. Further, there is currently no API endpoint to get internal statistics about queues and status. The development team is actively working to change this situation, but it will require some time to complete. While waiting for this development work to be delivered, we can (even right now!) use a complementary approach based on automatic detection of suspicious logs, and machine learning to understand Tornado’s behavioral baseline and to detect anomalies in behavior. For this we will make use of Kibana’s built-in Detection Rule and Machine Learning capabilities.
The Tornado Logs
Tornado and its collectors write in journalctl by default (as well as in /var/log/messages), but we can also configure a separate location. The format of the logs is simple:
Apr 08 09:35:46.831 INFO tornado_engine_matcher::config::fs: Loading filter from file: [/neteye/shared/tornado//conf////drafts//draft_001/config/filter.json]
We have the date (Apr 08 09:35:46.831), followed by the log level (INFO), then comes the Rust module, the function (tornado_engine_matcher::config::fs) and finally the actual message.
To ingest these logs according to the Elastic Common Schema (ECS), I wrote a Filebeat configuration file and an Elasticsearch pipeline to parse them. I set the Rust module in the tornado.module field, and also set the field event.module to tornado so that it is considered a module in Kibana. Finally, to distinguish the different executables, I also filled the event.dataset field with the values of the form tornado.<executable>, e.g., tornado.tornado, tornado.tornado_webhook_collector, tornado.tornado_icinga2_collector and so on.
The Kibana Logs Application
Once the logs are ingested we can view the logs of all Tornado executables, including those from satellites, in a central tool. The result will look similar to this:
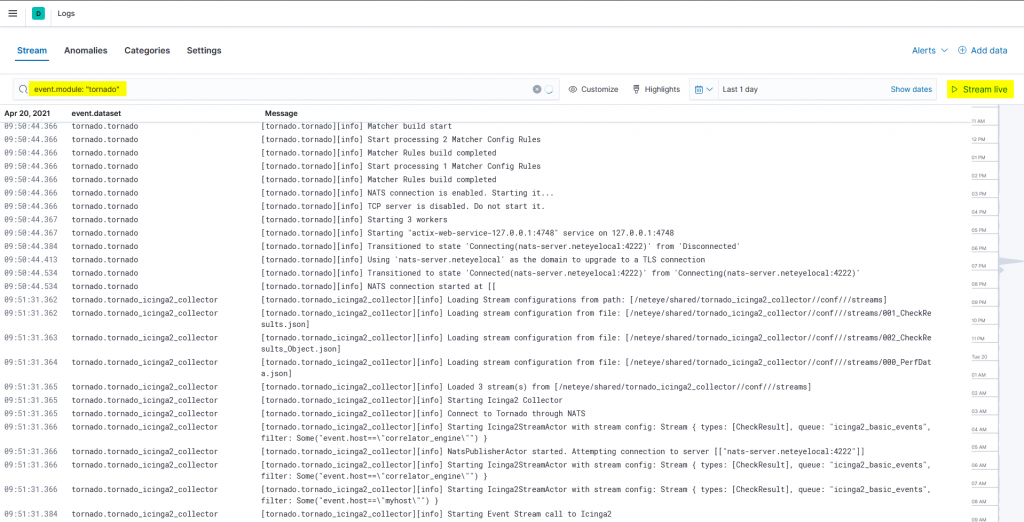
You can also start the stream and see the logs of the different tornado executables live in a central tool. And since we added the fields tornado.module, event.module, event.dataset and host.name, you can select exactly which logs you want to show.
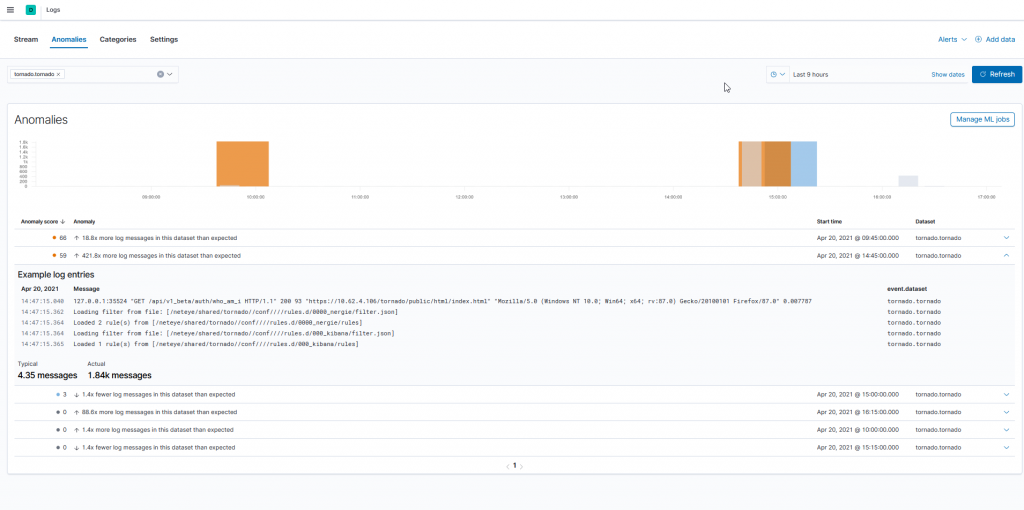
Inside the Logs Application, we can create a Machine Learning Job to automatically detect anomalous log entry rates categorized by the event.dataset field. To do so, we can open the Anomalies tab and use the wizard to create a job for the different Tornado datasets. The result for the tornado.tornado dataset might look like this:
Furthermore, we can even create a ML Job to categorize the different kind of logs inside a dataset. We can open the Categories tab and use the wizard to create a job. The result consists of a table with message_count and the category.
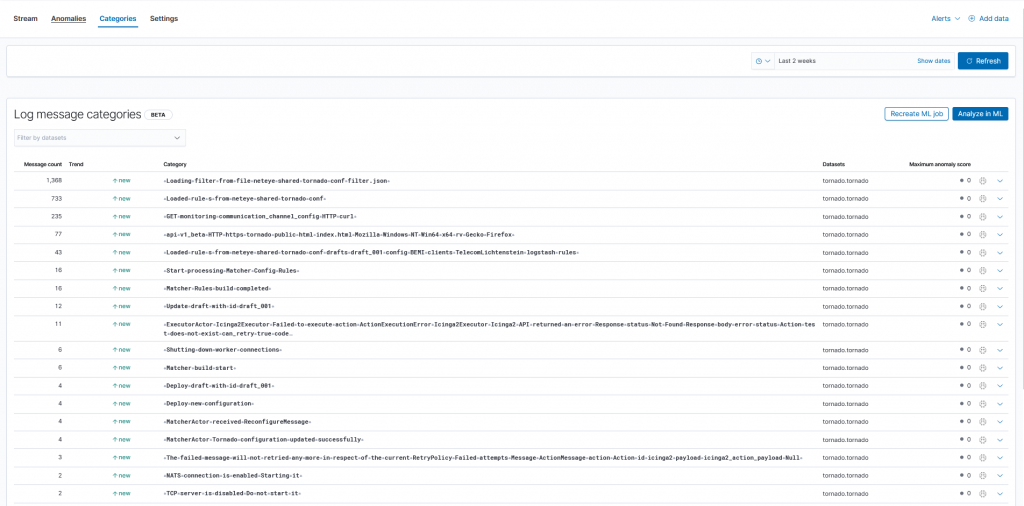
By clicking on the dropdown menu we get examples for the various categories. The identified anomalies can be sent as notifications through detection rules or the Kibana alerting mechanism. In this section we only analyzed the log rate, but what about actual errors during execution?
Detection Rules
Having ingested the logs, the possibility of streaming them and identifing anomalies in the log-rate is a big deal, but can we do even more? Well, yes: we can exploit Detection Rules to detect issues in Tornado execution. We could for example generate an alarm for each message from Tornado Core based on its “error” log level:
event.dataset: "tornado.tornado" and log.level: "tornado"
This rule is quite generic and thus could produce many false positives. We can go a step further and refine the rule to detect particular actions. In the following subsection I cover a particular concrete use case.
Use-Case: Detecting Failed Actions
In Tornado the last step in the processing of events is the execution of actions, e.g., changing an object’s status in IcingaWeb, indexing Elasticsearch documents, and so on. If an action fails, Tornado will try to perform the action again according to its RetryPolicy. Each failed attempt produces a log entry similar to this one:
Apr 20 16:30:36.897 ERROR tornado_engine::executor: ExecutorActor - Icinga2Executor - Failed to execute action: ActionExecutionError: [Icinga2Executor - Icinga2 API returned an error. Response status: 404 Not Found. Response body: {"error":404.0,"status":"Action 'test' does not exist."}], can_retry: true, code: None
but when there are no attempts left, a warning message is produced. For example:
Apr 20 16:30:36.898 WARN tornado_engine::executor::retry: The failed message will not be retried any more in respect of the current RetryPolicy. Failed attempts: 4. Message: ActionMessage { action: Action { id: "icinga2", payload: {"icinga2_action_name": Text("test"), "icinga2_action_payload": Null} } }
I think that in this case it’s better to detect when an action failed after the configured number of retries, because it indicates a more significant problem. Indeed, failures with only a single attempt may be caused by temporary problems. So we could write a rule like this:
event.dataset: "tornado.tornado" and tornado.module: "tornado_engine::executor::retry" and log.level: "warn" and message: "will not be retried any more"
Final Considerations
Log Level
Increasing the log level beyond info (e.g., debug or even trace) will allow us to construct a more precise model on the “expected behavior” of Tornado and the data it collects, but the cost will be a massive increase in the space used. Thus it’s necessary to find a tradeoff between precision and storage costs. Fortunately, in the latest releases of Tornado it’s possible to choose the log level for each library, thus increasing the granularity.
Alerting Mechanism
Once the detection rules find matches, we can send alarms to the relevant stakeholders. Usually, for raising alarms we would leverage Tornado, but in this case we cannot use Tornado (at least) exclusively, because we want to find issues related to Tornado itself. In other words, the problem can be summarized as “Who watches the watchers?”.
If Tornado has issues in connecting to Icinga, we certainly can’t rely on the generation of Icinga2 status changes. Thus, we need alternative or redundant mechanisms. We can configure Kibana to directly send emails to the user, or we can implement icinga active checks to read the number of matches of single Detection Rules relative to Tornado.
Summary
In this post I presented how we can exploit the Elasticsearch Stack and the Tornado logs to better understand if there are problems in the execution of Tornado or its collectors. I described how we can use the Kibana Logs Application to view the logs of the different Tornado executables (even in Satellites) without needing to type a single command in the CLI. Then I discussed how we can exploit Detection Rules and Machine Learning Jobs to detect possible misconfigurations and anomalies in the number of logs. Finally, I added some food for thought about the log-level and alarming mechanism.
Conclusion and Open Challenges
In this post, I’ve only just scratched the surface of what’s possible with this concept. Based on a finer analysis of the messages, we could improve the log parsing by taking into consideration the most significant message log classes. For instance, better parsing will enable us to write rules that are more precise and build finer ML-models. Moreover, in this blog I only used the preconfigured ML jobs of the Kibana Logs application, which use only event.dataset as a classifier, but we could also work with other parsed fields, like the log level and the tornado module.


Mirko Bez
Consultant at Würth Phoenix
Author
Latest posts by Mirko Bez
23. 12. 2020
Log-SIEM
How I Became an Elastic Certified Professional