
06. 08. 2020
Mirko Bez
Log Management
Firewall Log Collection: An Elastic Stack Performance Tuning Fairy Tale
In this blog post I will describe my experience with ingesting logs from a Fortinet firewall at a customer site. During this process I exploited the brand new Filebeat 7.8.0 Fortinet module. In particular, I will describe how I went from 3K events per second (eps) to 32K eps, more than a 10x improvement.
The Concept
The firewall sends logs according to the Syslog Protocol (over TCP) to a dedicated virtual machine with modest hardware, let’s call it the “collector”, which performs load balancing during event forwarding to four Elasticsearch ingest nodes.
Logstash on the Collector
First I opted to use Logstash on the collector, because I had already installed this tool on the VM and it had successfully managed to cope with the rsyslog traffic we were experiencing (around 2K events per second) coming from other Linux servers.
To exploit the imported Filebeat pipeline, I used the following Logstash filter that does nothing other than indicate the Fortinet Firewall Elasticsearch pipeline and the index name. Basically, the main job is performed by many, but not all, Filebeat modules:
input {
  # Both tcp and udp are used
  syslog {
    port => 9044
    grok_pattern => "<%{POSINT:[log][syslog][priority]}>"
    add_field => { "[agent][type]" => "syslog" }
    codec => plain { charset => "CP1252" }
  }
}

filter {
        mutate {
           add_field => {
            "[@metadata][index]" => "firewall-%{YYYY.MM.dd}"
            "[@metadata][pipeline]" => "filebeat-7.8.0-fortinet-firewall-pipeline"
           }
        }
}

output {
     elasticsearch {
         hosts => ["https://node-1.mydomain:9200",
                   "https://node-2.mydomain:9200",
                   "https://node-3.mydomain:9200",
                   "https://node-4.mydomain:9200"]
         index => "%{[@metadata][index]}"
         pipeline => "%{[@metadata][pipeline]}"
         codec => plain
         ...
      }
}
Once we attached the firewall logs, we saw that we were ingesting about 3K events per second (eps). I was happy at this point, because apparently there were no issues in monitoring, the logs were arriving, and the cluster did not send responses with error codes “429” (“Too many requests” to Logstash). However, after one or two hours, we noticed an increasing delay in incoming events. After one night, the delay reached more than 12 hours.
So I contacted the Linux administrator and grew dismayed: apparently, during business hours the firewall typically produces more than 22K eps. There was a gap of around 19K eps we had to make up!
A bit naively I thought that switching to UDP would lead to better performance; however, it only lead to losing data without realizing how much data I was losing. From the perspective of the remote syslog host, however, the situation seemed perfect as all logs were sent.
So I turned back to TCP and tried to tune Logstash. I began by modifying the following parameters in the pipeline.yml file:
- pipeline.workers: The number of threads per pipeline
- pipeline.batch.size: The number of elements to process contemporaneously
With my first attempts, I managed to reach 17K eps. That still wasn’t enough.
A Second Approach: Logstash on a Super-performant Server
I tried to work with a NetEye node with a massive amount of resources. I set the Heap Max Space for Logstash to 26GB and used the same parameters found for the collector machine. With these and other parameters, I still couldn’t exceed the 12K eps limit, which didn’t make sense to me. So, I opened the Logstash configuration file logstash.yml and found the incriminating line (which, obviously, I had added): queue.type: persisted. This line causes all events to be written to disk before being sent to the output. The main advantage of persistent queues is protection against data loss in case of abnormal terminations, and as a buffer between clients and Elasticsearch. The main undesired side effect is that performance loss.
By returning the setting to queue.type: memory I reached the objective: 25K eps. There was still hope for making up that gap! I let it run overnight and the next day confirmed the changes were successful (during night the traffic to the firewall drops to 12K eps).
Going Back to the Beginning: Tuning Logstash on the Collector
I went back to the original Logstash and used the brand new parameters. I reached 17K eps, but the graphs clearly showed that garbage collection was continuously active. So I tried to increase memory size well beyond the “safe” threshold of half of the total amount of RAM, from 8GB to 14GB out of 16GB available.
That’s when I reached the desired constant rate of 23K eps:
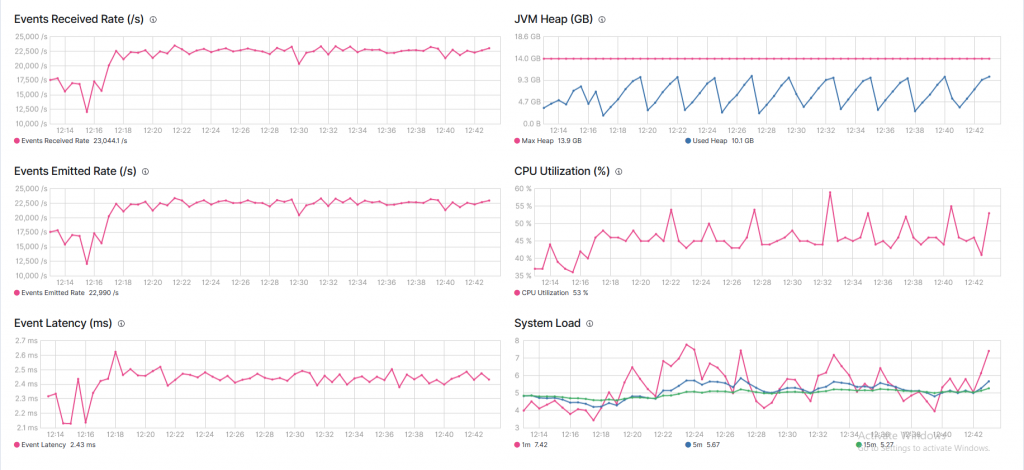
Each sudden drop in memory usage represents a garbage collection event, which means that the JVM is on hold and memory is being compacted. This pattern is a clear indication that there is not enough memory!
I was left with two ways to solve the problem: either begging the Linux admins for more resources (RAM) without any guarantee that I could cope with the same traffic, or find another way.
A Happy Ending: Filebeat on the Collector
After my tedious experience with Logstash, I decided to give Filebeat a try. I found a particularly interesting article on the Elasticsearch blog that describes the process of tuning Filebeat. Two of the main parameters involved in tuning are bulk_max_size and worker. According to the linked blog post, usually big bulk sizes are better. However in my experiments it didn’t make much difference. Actually, increasing it didn’t lead to the expected performance (perhaps due to the I/O-bound nature of my requests). The number of workers instead did make a big difference: from 3K eps I went to 8K eps (with 100 workers). With netstat I saw that the number of connections is equal to the product of the number of workers and hosts.
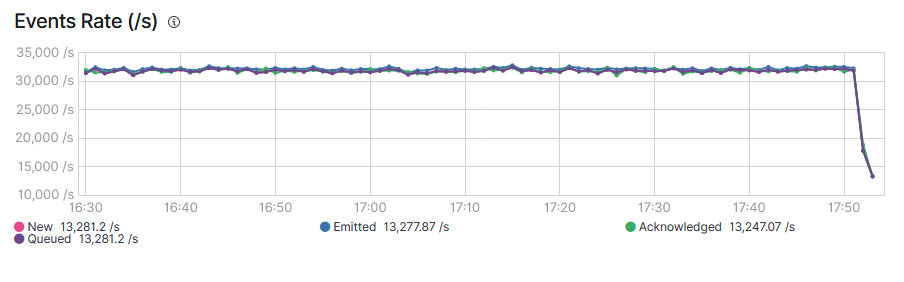
However, the results were still not enough. So I decided to also increase the memory queue: doubling, quadrupling and so on always brings better performance. So I decided to set a large number 96000 (against the default 2048) and that’s when I reached 32K eps. The servers were responding from time to time with “429 too many requests” warnings, meaning that Filebeat was saturating the servers with less than 2GB of RAM.
32K eps meant that each second the pipeline would catch up on 9K events. So after about 2 hours, the queue had emptied:
Over a period of four days , the situation looked very stable:
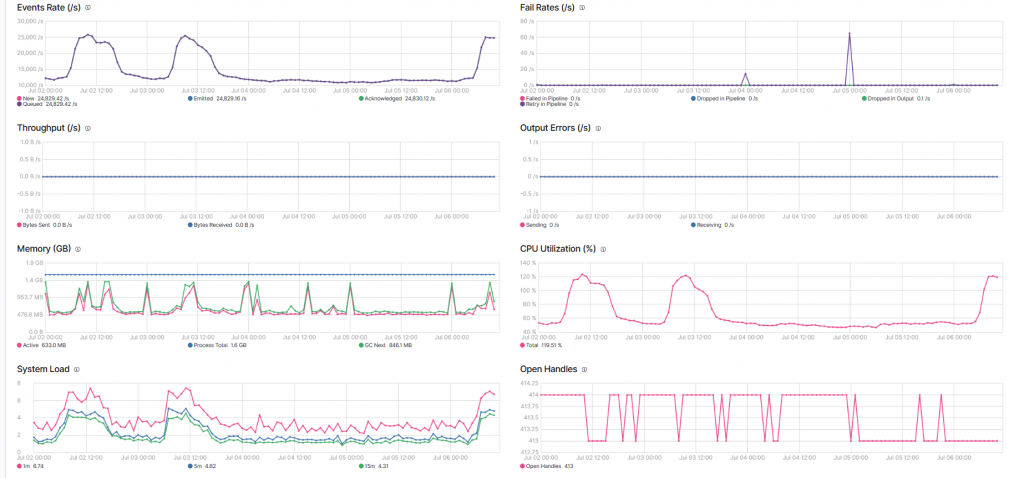
The memory usage is a fraction of what’s needed by Logstash, and the trend is pretty clear. Occasionally the failure rate is non-zero, meaning that the Elasticsearch Servers are occupied and cannot process all requests.
Lessons Learned
- “Know your Enemy”: Before collecting logs from a new source, we highly recommend that you know your expected traffic rate
- Persistent queue sounds intriguing, but disk I/O is a limiting factor, even with super fast SSDs. One viable approach could be to distribute the load across multiple Logstash instances. This would require a load-balancer between the rsyslog source and Logstash.
- Logstash tuning is possible and advisable, but memory usage increases massively. Since the JVM cannot efficiently use more than 32GB of heap space, we reach another limit.
- Filebeat is really as lightweight as promised, and the Go runtime system can really exploit hardware resources, especially in the presence of I/O-bound processes, such as in this case where the main objective of Filebeat was to indicate which pipeline to use.
- Performance tuning is an exciting process with steps both forward and backward. The important thing is to not give up!

Mirko Bez
Consultant at Würth Phoenix
Author
Latest posts by Mirko Bez
21. 04. 2021
Log Management, NetEye, Unified Monitoring
Automatically Detecting Tornado Anomalies through its Logs
23. 12. 2020
Log-SIEM
How I Became an Elastic Certified Professional