


31. 03. 2026
Log-SIEM, NetEye, Unified Monitoring

31. 08. 2020
Giuseppe Di Garbo
Development, NetEye
Getting in Touch with the Flux Language and NetEye
NetEye is a constantly evolving solution that allows you to monitor the status of heterogeneous objects and collect metrics from different sources. Properly correlated, this data can become an important source of information for your business.
With the 4.13 release we added an important tool that allows you to manage data: we upgraded InfluxDB to version 1.8.0, which brings with it the new Flux language as a stable feature.
Flux is a functional data scripting language designed for querying, analyzing, and acting on data.
Flux is an alternative to InfluxQL with additional functionality like:
- joins
- math across measurements
- sort by tags
- group by any column
- histograms
- and more…
Here you can find all the differences between Flux and InfluxQL.
Concepts
Bucket
A bucket is a named data source with a retention policy. It’s similar to a database, but is a combination of both a database and a retention policy.
Pipe-forward operator
Flux uses pipe-forward operators (|>) to chain operations together.
Table
Flux structures all data in tables. Data is returned in annotated comma-separated values (CSV), representing tables.
Group keys
It’s a list of columns for which every row in the table has the same value.
Here you can find the official getting started guide for Flux.
Flux Queries
Connecting to InfluxDB database
Let’s start with an easy example to query metrics from the icinga2 InfluxDB database:
# influx -type flux -path-prefix /api/v2/query

from(bucket: "icinga2")
|> range(start: -1h)
|> filter(fn: (r) => r.hostname =~ /switch001.*/ and r._measurement == "hostalive" and r._field == "value")
|> aggregateWindow(every: 20s, fn: mean, createEmpty: false)
|> limit(n:2)
|> yield(name: "mean")
Starting with this example, we can get familiar with Flux. Each query needs at least three parameters:
- “from”, the data source
- a time range
- data filters
In our example we can find:
- influx -type flux -path-prefix /api/v2/query
- this is the simplest way to connect to InfluxdDB and use the Flux language
- from(bucket: “icinga2”)
- start with getting data from icinga2 database, the default influx database in which the metrics for each host created in NetEye are written
- A sequence of pipe-forward operators (|>)
- It is used to send the output of the previous function to the next one
- range(start: -1h)
- The
range()function filters records based on time bounds.
- The
- filter(fn: (r) => r.hostname =~ /switch001.*/ and r._measurement == “hostalive” and r._field == “value”)
- The
filter()function filters data based on conditions defined in a predicate function. In this example, we filtered a specifc host, measuremente and field.
- The
- aggregateWindow(every: 20s, fn: mean, createEmpty: false)
- The
aggregateWindow()function applies an aggregate or selector function to fixed windows of time.
- The
- limit(n:2)
- the
limit()function limits each output table to the firstnrecords. In this example, the limit is 2 records.
- the
- yield(name: “mean”)
- The
yield()function indicates the input tables received should be delivered as a result of the query.
- The
And here is the output:
Result: mean
Table: keys: [_start, _stop, _field, _measurement, hostname, metric]
_start:time _stop:time _field:string _measurement:string hostname:string metric:string _value:float _time:time
------------------------------ ------------------------------ ---------------------- ---------------------- ---------------------- ---------------------- ---------------------------- ------------------------------
2020-08-31T13:16:59.616173753Z 2020-08-31T14:16:59.616173753Z value hostalive switch001 pl 0 2020-08-31T13:17:20.000000000Z
2020-08-31T13:16:59.616173753Z 2020-08-31T14:16:59.616173753Z value hostalive switch001 pl 0 2020-08-31T13:17:40.000000000Z
Table: keys: [_start, _stop, _field, _measurement, hostname, metric]
_start:time _stop:time _field:string _measurement:string hostname:string metric:string _value:float _time:time
------------------------------ ------------------------------ ---------------------- ---------------------- ---------------------- ---------------------- ---------------------------- ------------------------------
2020-08-31T13:16:59.616173753Z 2020-08-31T14:16:59.616173753Z value hostalive switch001 rta 0.0005205 2020-08-31T13:17:20.000000000Z
2020-08-31T13:16:59.616173753Z 2020-08-31T14:16:59.616173753Z value hostalive switch001 rta 0.00056775 2020-08-31T13:17:40.000000000Z
Connecting to MySql database
Here is another interesting example to test Flux to connect to an external mysql database:
import "sql"
sql.from(
driverName: "mysql",
dataSourceName: "nedireadonly:XXXXXXXXXX@tcp(mariadb.neteyelocal:3306)/nedi",
query: "select lower(device) as hostname,serial,vendor from devices where device = 'SWITCH001'"
)
And here is the output:
Result: _result
Table: keys: []
lower(device):string serial:string vendor:string
---------------------- ---------------------- ----------------------
switch001 FXW53XXXXXXX Cisco
Multi-Data source connection
And now let’s merge information from two different sources together using join function.
import "sql"

icinga2 = from(bucket: "icinga2")
|> range(start: -1h)
|> filter(fn: (r) => r.hostname =~ /switch001.*/ and r._measurement == "hostalive" and r._field == "value")

nedi = sql.from(
driverName: "mysql",
dataSourceName: "nedireadonly:XXXXXXX@tcp(mariadb.neteyelocal:3306)/nedi",
query: "select lower(device) as hostname,serial,vendor from devices where device = 'SWITCH001'"
)

join(tables: {t1: icinga2, t2: nedi}, on: ["hostname"])
|> limit(n:2)
And here is the result:
Result: _result
Table: keys: [_field, _measurement, _start, _stop, hostname, metric]
_field:string _measurement:string _start:time _stop:time hostname:string metric:string _time:time _value:float serial:string vendor:string
---------------------- ---------------------- ------------------------------ ------------------------------ ---------------------- ---------------------- ------------------------------ ---------------------------- ---------------------- ----------------------
value hostalive 2020-08-31T14:10:29.944444873Z 2020-08-31T15:10:29.944444873Z switch001 pl 2020-08-31T14:10:33.000000000Z 0 FXW53XXXXXXX Cisco
value hostalive 2020-08-31T14:10:29.944444873Z 2020-08-31T15:10:29.944444873Z switch001 pl 2020-08-31T14:10:38.000000000Z 0 FXW53XXXXXXX Cisco
Table: keys: [_field, _measurement, _start, _stop, hostname, metric]
_field:string _measurement:string _start:time _stop:time hostname:string metric:string _time:time _value:float serial:string vendor:string
---------------------- ---------------------- ------------------------------ ------------------------------ ---------------------- ---------------------- ------------------------------ ---------------------------- ---------------------- ----------------------
value hostalive 2020-08-31T14:10:29.944444873Z 2020-08-31T15:10:29.944444873Z switch001 rta 2020-08-31T14:10:33.000000000Z 0.006132 FXW53XXXXXXX Cisco
value hostalive 2020-08-31T14:10:29.944444873Z 2020-08-31T15:10:29.944444873Z switch001 rta 2020-08-31T14:10:38.000000000Z 0.000806 FXW53XXXXXXX Cisco
Working with Flux on Grafana
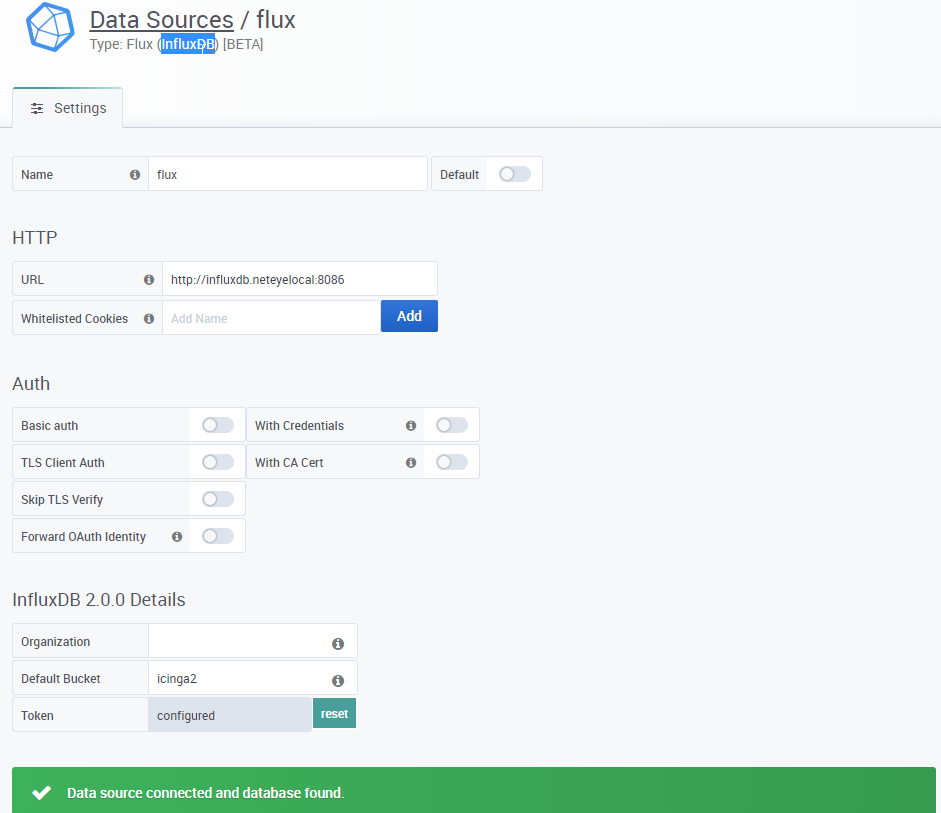
It is also possible to use Flux with Grafana through the Flux datasource.
This datasource is in a beta version in the current Grafana release available in NetEye 4.13
Here you can find how to create the datasource:
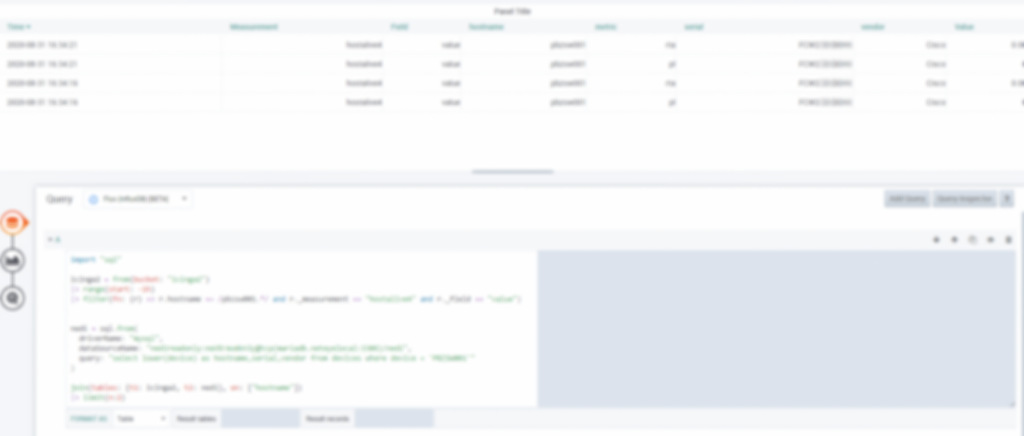
And here you can find the example seen above represented in the form of a table in Grafana:
Conclusion
Here ends our getting in touch, but I hope I have stimulated the interest in this new tool that will surely allow us to better use all the data present in NetEye to transform them into business informations!

Giuseppe Di Garbo
Consultant at Würth IT Italy
Hi everybody. I’m Giuseppe and I was born in Milan in 1979. Since the early years of university, I was attracted by the Open Source world and operating system GNU\Linux. After graduation I had the opportunity to participate in a project of a startup for the realization of an Internet Service Provider. Before joining Würth Phoenix (now Würth IT Italy) as SI consultant, I gained great experience as an IT consultant on projects related to business continuity and implementation of open source software compliant to ITIL processes of incident, change and service catalog management. My free time is completely dedicated to my wife and, as soon as possible, run away from Milan and his caotic time and trekking discover our beautiful mountain near Lecco for relax and lookup the (clean) sky.
Author
Latest posts by Giuseppe Di Garbo
19. 12. 2025
Atlassian, Service Management
Jira Service Management Customer Detail Fields: A Practical Use Case
29. 09. 2025
Atlassian, Service Management
Streamlining Service Request Management with ITIL4 and Jira Service Management
30. 06. 2025
Atlassian, Service Management
Creating Jira Service Management Requests from a Public Website? Here’s the Secure, No-API Way
28. 03. 2025
Atlassian, Service Management
Effortless On-Call Management with Jira Service Management