


31. 03. 2026
Log-SIEM, NetEye, Unified Monitoring

“A dashboard should tell a story or answer a question”
“Dashboards should reduce cognitive load, not add to it“
Following the two best practices mentioned above I would like to consider the following use case: I am a NetEye customer with a single node implementation and I would like a dashboard that helps me to quickly understand how is the health status of my NetEye system (from the point of view of performance monitoring and host performance).
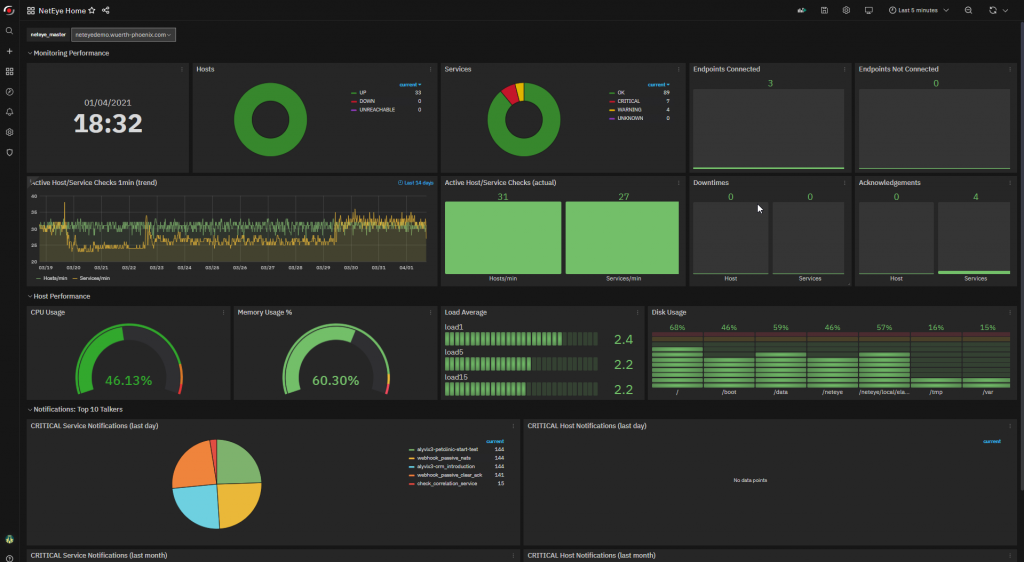
To answer this request, I created the “NetEye Home Dashboard” dashboard on our demo environment.
The purpose of this dashboard is to show the most important indicators relating to the core monitoring performance (host and service status, endpoint connections, active hosts and services, acknowledgements and downtimes) and the NetEye server performance (cpu and memory usage, load average, disk usage).
Furthermore, in this dashboard you will find some statistics relating to notifications shown on two time bases: last day and last month.
The statistics concern the top 10 services and hosts that generated CRITICAL status notifications.
Requirements
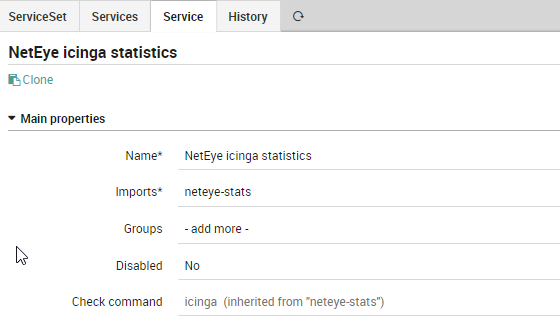
NetEye statistics service check
Your NetEye monitored host needs a service check that use icinga check command. If missing, you can create a new one following this example:
Telegraf service
To collects local performance metrics for your NetEye server you can you use the telegraf service.
Your /neteye/shared/telegraf/conf/telegraf.conf must have at least these inputs plugins enabled:
[[inputs.cpu]]
[[inputs.disk]]
[[inputs.mem]]
[[inputs.system]]
If missing, you have to correct the telegraf.conf and enable and restart telegraf service:
# systemctl enable telegraf
# systemctl restart telegraf
# systemctl status telegraf
Database
Statistics relating to notifications are collected using SQL queries to the local icinga database. You will need a Grafana data source able to connect to local mariadb database with a read only user:
# mysql icinga
.....
MariaDB [icinga]> create user 'icingareadonly'@'localhost' identified by 'XXXXXXXXXXXX';
Query OK, 0 rows affected (0.026 sec)

MariaDB [icinga]> grant select on icinga.* to 'icingareadonly'@'localhost';
Query OK, 0 rows affected (0.002 sec)

MariaDB [icinga]> flush privileges;
Query OK, 0 rows affected (0.005 sec)
Grafana data sources
The dashboard needs two different new Grafana data sources:
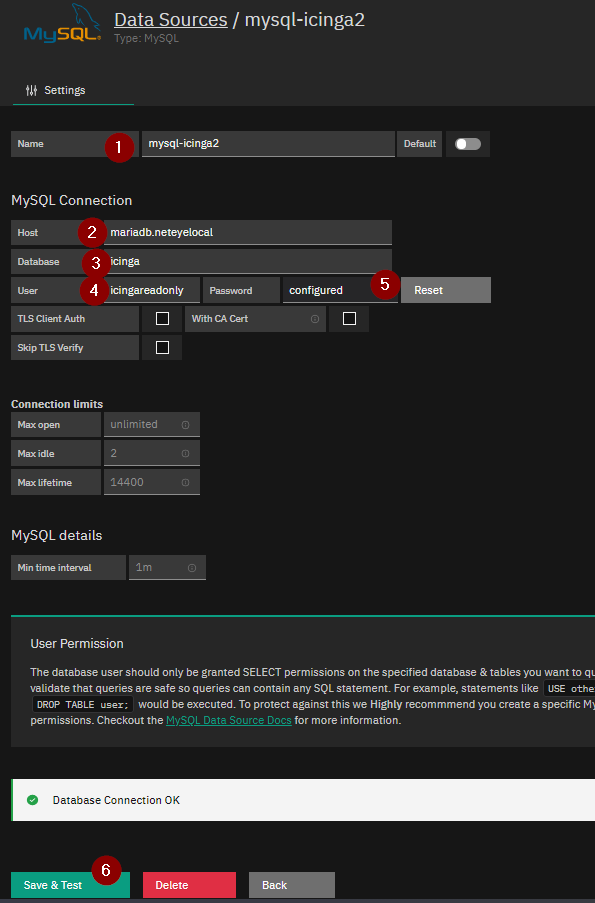
- mysql-icinga2: to connect to local mariadb database
- Telegraf: to connect to local telegraf database
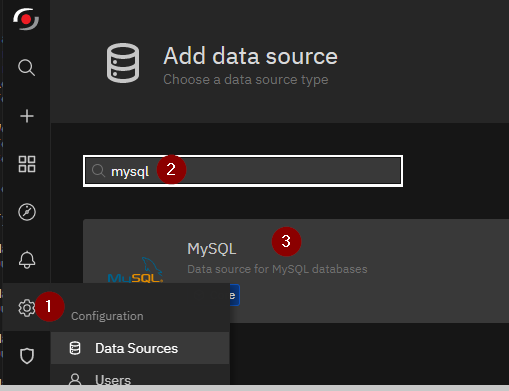
Mysql data source
From ITOA – Data Sources menu you can create a new MySQL datasource following these steps:
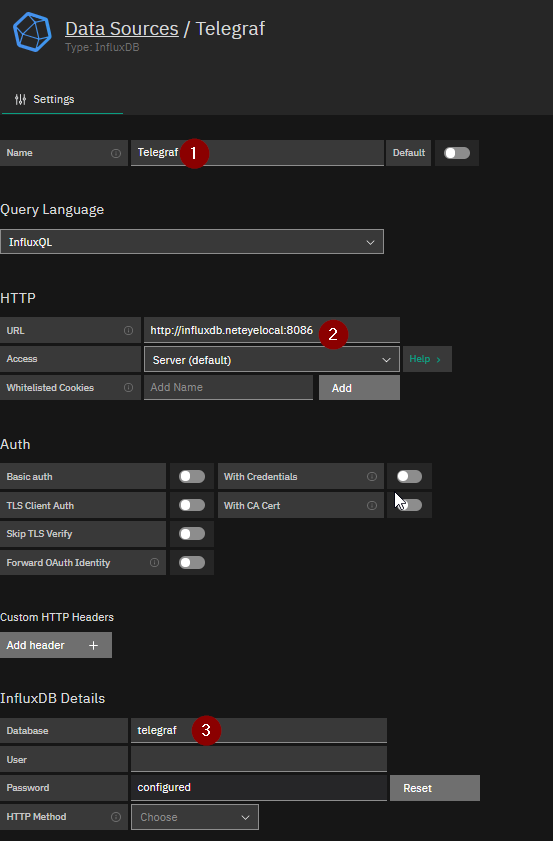
Telegraf data source
From ITOA – Data Sources menu you can create a new Telegraf datasource following these steps:
Grafana pie-chart and clock-panel plugins installation
The dashboard requires piechats and clock panel plugins. You can install them following these steps:
# chmod +x /usr/share/grafana/bin/grafana-cli
# grafana-cli plugins install grafana-piechart-panel
# grafana-cli plugins install grafana-clock-panel
Export and import the dashboard
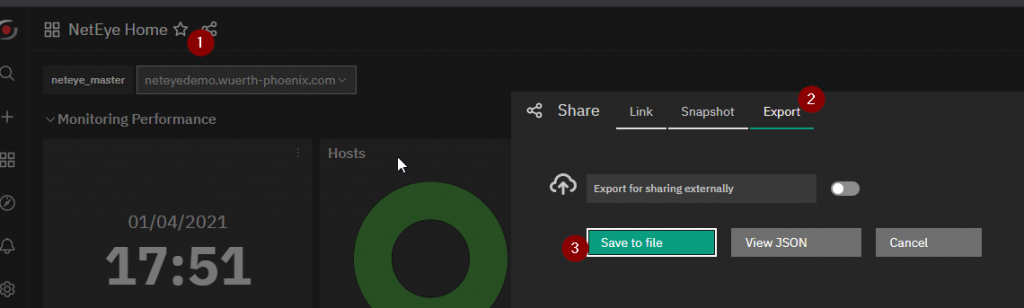
Now you can export the dashboard from our NetEye demo system following this link using “save to file” in JSON format.
Finally you can import the dashboard in your NetEye system.
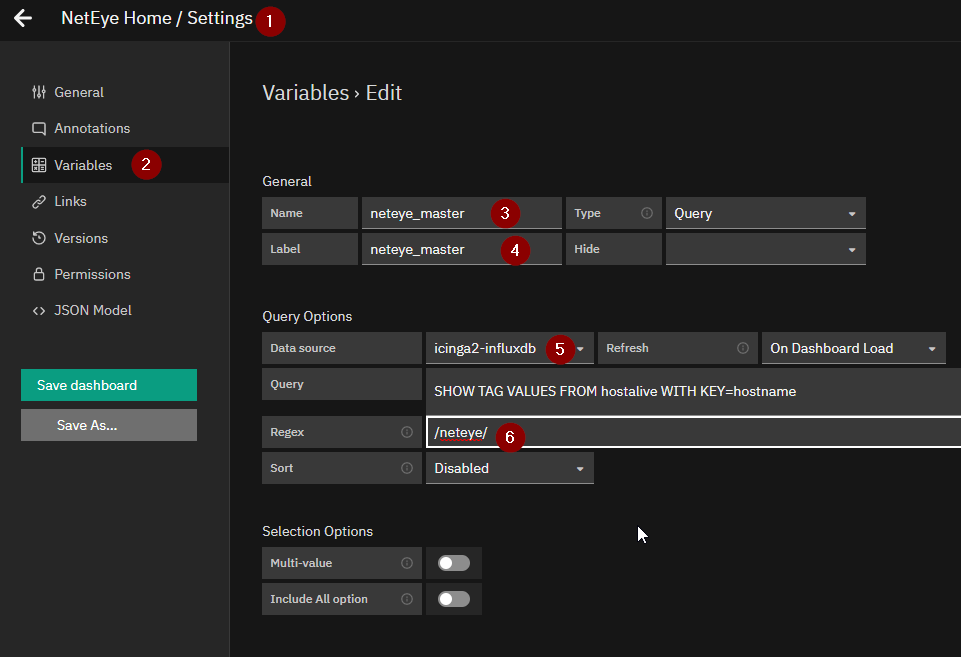
Pay attention: after the import you will need to correct the default Regex related to neteye_master variable from dashboard settings. The simple Regex /neteye/ used in our demo environment must be corrected selecting the correct hostname related to your NetEye monitored host following this example:

Giuseppe Di Garbo
Consultant at Würth IT Italy
Hi everybody. I’m Giuseppe and I was born in Milan in 1979. Since the early years of university, I was attracted by the Open Source world and operating system GNU\Linux. After graduation I had the opportunity to participate in a project of a startup for the realization of an Internet Service Provider. Before joining Würth Phoenix (now Würth IT Italy) as SI consultant, I gained great experience as an IT consultant on projects related to business continuity and implementation of open source software compliant to ITIL processes of incident, change and service catalog management. My free time is completely dedicated to my wife and, as soon as possible, run away from Milan and his caotic time and trekking discover our beautiful mountain near Lecco for relax and lookup the (clean) sky.
Author
Latest posts by Giuseppe Di Garbo
19. 12. 2025
Atlassian, Service Management
Jira Service Management Customer Detail Fields: A Practical Use Case
29. 09. 2025
Atlassian, Service Management
Streamlining Service Request Management with ITIL4 and Jira Service Management
30. 06. 2025
Atlassian, Service Management
Creating Jira Service Management Requests from a Public Website? Here’s the Secure, No-API Way
28. 03. 2025
Atlassian, Service Management
Effortless On-Call Management with Jira Service Management